 Psychological Line (Indicator)
Input Information
| Name | Expression | Default | Description |
| Price | Numeric | Close | Value used in calculating the psychological line ratio. |
| Length | Numeric | 10 | Bars over which to calculate the psychological line ratio. |
| OverSold | Numeric | 25 | Level at which you consider the market to be oversold (too low). |
| OverBought | Numeric | 75 | Level at which you consider the market to be overbought (too high). |
| ColorCellBGOnAlert | TrueFalse | True | True to change the background color of a grid cell when an alert occurs (see following input); otherwise False to not color cell. |
| BackgroundColorAlertCell | Numeric | DarkGray | The background color value for a grid cell when an alert occurs (see previous input) |
Market Synopsis
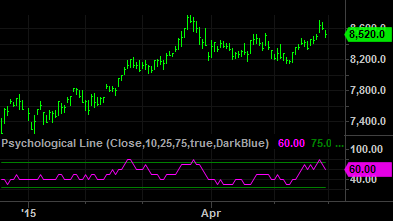
The Psychological Line indicator calculates a ratio based on the number of up bars (price higher than previous bar) over a specified number of bars. A ratio greater than 50 (50%) indicates that there are more buyers than sellers. If below 50, there are more sellers than buyers. A psychological line value that crosses above the OverBought line may indicate weakness on the long side while crossing below the OverSold line may indicate weakness on the short side. It is available for Chart Analysis and RadarScreen.
Plot Information
| Number | Name | Default Color | Description |
| Plot1 | PsycLine | Magenta | Plots the psychological line value. |
| Plot2 | OverBot | Green | Plots a reference line at the OverBought level. |
| Plot3 | OverSold | Green | Plots a reference line at the OverSold level. |
| Plot4 | OB/OS Zone | Cyan | Displays a message (grid only) when an alert occurs when the value exceeds a high or low alert values. |
When applied to a chart, this indicator displays one plot and two reference lines in a separate subgraph from the price data.