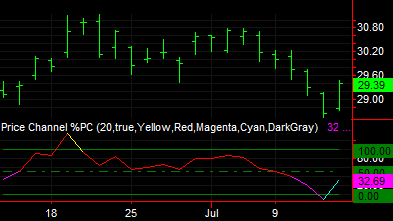
 Price Channel % PC (Indicator)
Input Information
| Name | Expression | Default | Description |
| Length | Numeric | 20 | Number of bars to include in the calculation. |
| ColorPercentP | TrueFalse | True | True to change %P plot based on the following colors. |
| PercentPVeryHighColor | Numeric | Yellow | Color used for %P values greater than 100. |
| PercentPHighColor | Numeric | Red | Color used for %P values greater than or equal to 50. |
| PercentPLowColor | Numeric | Magenta | Color used for %P values less than 50. |
| PercentPVeryLowColor | Numeric | Cyan | Colorused for %P values less than 0. |
| BackgroundColorAlertCell | Numeric | DarkGray | Background for RadarScreen cell when an alert occurs. |
Market Synopsis
The Price Channel % PC indicator calculates the percent change of the price channel.
PercentP = ( Close - LowerChannel ) / ( UpperChannel - LowerChannel )
The price channel calculates the highest high and lowest low of the trailing number of bars specified by the input Length. When a market moves above the upper band, it is a sign of market strength. Conversely, when a market moves below the lower band, it is a sign of market weakness. A sustained move above or below the channel lines may indicate a significant breakout.
Plot Information
| Number | Name | Default Color | Description |
| Plot1 | %P | Cyan | Plots the trailing low as a line. |
| Plot2 | 100 | DarkGreen | Plots a reference line at 100%. |
| Plot3 | 50 | DarkGreen | Plots a reference line at 50%. |
| Plot4 | 0 | DarkGreen | Plots a reference line at 0 |
When applied to a chart, this indicator plots in a separate subgraph from the price data.