 Positive Volume Index (Indicator)
Input Information
No inputs
Market Synopsis
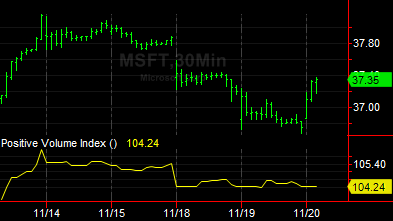
The Positive Volume Index (PVI) is a cumulative value (starting from 100) that is calculated by adding the percent change of the Close (from the prior bar) to the prior bar PVI value if the volume of the current bar is greater than the volume of the prior bar. Since this is an accumulative calculation, the function must be a series function to ensure it is called on every bar.
Plot Information
| Number | Name | Default Color | Description |
| Plot 1 | PVI | Magenta | Plots the PVI as a line. |
When applied to a chart, this indicator displays a plot in a separate subgraph from the price data.