 Parabolic SAR (Indicator)
Input Information
| Name | Type | Default | Description |
| AfStep | Numeric | .02 | Acceleration factor used to calculate the parabolic. |
| AfLimit | Numeric | .2 | Limitation on the acceleration factor. |
| UsePlotColoring | TrueFalse | True | When true, changes plot color based on whether the price is above or below the parabolic. |
| PriceAbvParabColor | Numeric | Cyan | Plot color to use when prices are above the parabolic and UsePlotColoring is true. |
| PriceBlowParabColor | Numeric | Magenta | Plot color to use when prices are below the parabolic and UsePlotColoring is true. |
| ColorCellBGOnAlert | TrueFalse | True | When true, changes grid cell background color when alert criteria is met. |
| BackgroundColorAlertCell | Numeric | DarkGray | Background color of grid cell based on alert. |
Market Synopsis
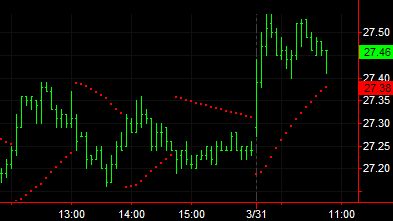
The Parabolic SAR indicator, based on Welles Wilder's Parabolic Time/Price Strategy, is based on the relationship between a market's price and time. It is used to determine when to stop and reverse (SAR) a position utilizing time/price-based stops. Once a Parabolic SAR is reached, the current position is exited and a new position in the opposite direction is taken. It is primarily used in trending markets and is based on always having a position in the market. The indicator may also be used to determine stop points and estimating when you would reverse a position and take a trade the opposite direction. The indicator derives its name from the fact that when charted, the pattern resembles a parabola or French curve.
Plot Information
| Number | Name | Default Color | Description |
| Plot1 | ParCl | Red | Plots the parabolic value as a series of points. |
| Plot2 | CrossBarsAgo | Default | In a grid, plots the number of bars ago that the price last crossed the parabolic. |
When applied to a chart, this indicator contains one plot, displayed in the same subgraph as the price data. In a grid, two plots are displayed.