 Optimized Balance Conviction (Indicator)
Input Information
| Name | Expression | Default | Description |
| Divergence Period | Numeric | 14 | The look-back period (number of bars) from the current or selected bar for divergence analysis. Higher values measure and extend the divergence analysis over a longer time period. |
| Intensity Factor | Numeric | 50 | The higher the Intensity Factor, the less influence smaller price change moves will have on the OBC line relative to larger price moves. The range is from 0 to 100. |
| OBC Compression Threshold | Numeric | 80 | The Compression Threshold prevents large OBC Dollar price moves from skewing the OBC line. Higher values lower the upper compression threshold, resulting in more (moderate) values being compressed. The range is from 0 to 100. |
| OBC Compression Factor | Numeric | 75 | The Compression Factor prevents large OBC Dollar price moves from distorting the OBC line. Higher values result in more compression of moves over the upper OBC Compression Threshold. The range is from 0 to 100. |
| Dollar Volume Only = 0 | Numeric | 1 | Setting this value to 0 will calculate and display OBC with straight OBC Dollars only. It will remove all price performance weightings, intensity factors and compressions. A setting of 0 is generally avoided. |
| Study on = 1 | off = 0 | Numeric | 1 | Internal study method to turn the Optimized Balance Conviction study on or off. |
Market Synopsis
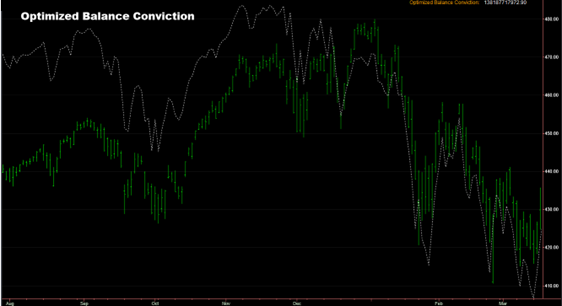
Optimized Balance Conviction (OBC) is an intensity-based indicator plotted as a single line over price. It plots a running total of OBC Dollars associated with upward and downward price movements. When a bar closes higher than the previous bar close, the bars OBC Dollar value is added to the running total; conversely, when a bars close is lower, the bars OBC Dollar value is subtracted.
OBC calculates and measures “conviction” by proportioning the magnitude of a price move with its associated intensity. To mitigate distortions caused by extreme price fluctuations or ultra-high intensity moves, it uses OBC Dollar (approximate dollar volume) along with a series of filters and buffers.
This methodology provides a more accurate representation of underlying market intensity, ensuring that larger price moves with higher relative intensity carry more weight than smaller price moves with lower intensity.
This approach gives greater significance to larger absolute price moves to those with lower absolute price moves with equal intensity as OBC proportions the size of the move. For example, a price move of 10% would have a higher effect on the OBC running total than a price move of 1% with the same intensity.
This approach also gives greater significance to high-intensity moves to those of lower relative intensity with the same percentage change in price. For example, a price move with 100 million dollars of activity would have a higher effect on the OBC Dollar running total than a same-size price move with only 10 million dollars of activity.
General OBC Interpretations:
• An increasing or upward-sloping OBC line indicates bullish conviction.
• A falling or downward-sloping OBC line indicates bearish conviction.
• A divergence between price direction and the OBC line may serve as an early warning of a potential trend reversal.
Due to the OBC’s calculation method, only its trend direction and relative values are used for analysis, as the absolute numeric value holds no significance.
Plot Information
| Number | Name | Default Color | Description |
| Plot 1 | OBC Level | Light Gray | Plots OBC as a dotted line over price. |
When Optimized Balance Conviction is applied to the upper price pane of a chart, it displays a single dotted line. The Optimized Balance Conviction numeric value is displayed in the data window.
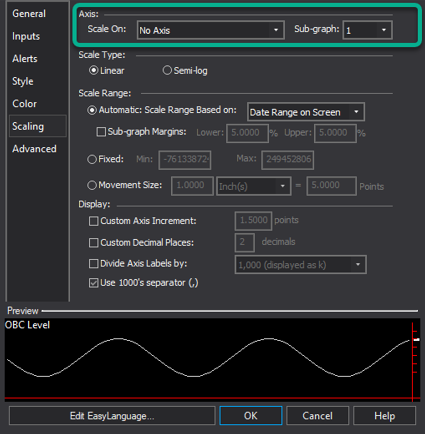
OBC Chart Settings
OBC Scaling | Axis | Scale On: No Axis
Sub-graph: 1
OBC Dollar Calculations
OBC Dollar Calculations
Optimized Balance Conviction utilizes OBC Dollars for its intensity-based measurement.
OBC Dollars (or OBC Dollar Volume) is a modified version of classic dollar volume, providing an extremely close approximation of a bar’s total dollar activity.
OBC Dollars are calculated as: Volume * ( (High + Low + Open + Close) / 4 )