 Opening Range (Indicator)
Input Information
| Name | Expression | Default | Description |
| OpeningRangeDuration_Hours | Numeric | 1 | Number of hours to include in the opening range. |
| OpeningRangeDuration_Minutes | Numeric | 0 | Number of minutes (in addition to number of hours) to include in the opening range. |
| OpeningRangeDuration_Seconds | Numeric | 0 | Number of seconds (in addition to the hours and minutes) to include in the opening range. |
| RegSessionOrAll_1_or_0 | Numeric | 1 | Set to 1 to plot the opening range of the regular session only. Set to 0 to plot the opening range of all sessions. |
| PriceOffsetAboveRangeHigh | Numeric | 0 | Enter the price amount above the high of the opening range at which to plot the high of the opening range. |
| PriceOffsetBelowRangeLow | Numeric | 0 | Enter the price amount below the low of the opening range at which to plot the low of the opening range. |
Market Synopsis
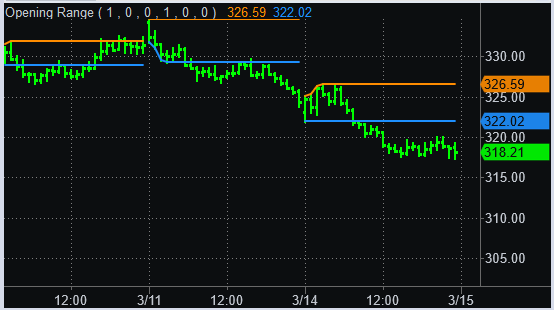
The Opening Range indicator calculates the highest high and lowest low of the user-specified period. Lines representing the high and low of the range are plotted.
The duration of the opening range period is specified through indicator inputs. If the opening range period ends during the construction of a bar, the opening range period's duration is extended automatically to include all of the prices in the bar during which the period ends.
Additional detailed comments can be found in the EasyLanguage code for this study. You can open the EasyLanguage code in the TradeStation Development Environment.
This indicator also can be applied to RadarScreen.
Plot Information
| Number | Name | Default Color | Description |
| Plot1 | ORgeHi+ | Dark Orange | Plots the opening range's high (plus an optional offset amount) as a line. |
| Plot2 | ORgeLo- | Dodger Blue | Plots the opening range's high (minus an optional offset amount) as a line. |
Related Functions