 OHLC Yesterday (Indicator)
Input Information
| Name | Expression | Default | Description |
| UseSessionOrDateChange_0_or_1 | Numeric | 0 | Determines whether price levels should be calculated based on session data (=0) or 24-hour daily data (=1). |
Market Synopsis
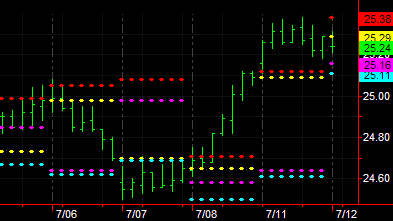
Plots yesterday's opening, high, low, and closing prices. Applies to daily, intra-day, and tick bar intervals only.
Primarily intended for RadarScreen but may be used in charting.
Plot Information
| Number | Name | Default Color | Description |
| Plot1 | YestOpen | Magenta | Plots yesterday's open. |
| Plot2 | YestHigh | Red | Plots yesterday's high. |
| Plot3 | YestLow | Cyan | Plots yesterday's low. |
| Plot3 | YestClose | Yellow | Plots yesterday's close. |
When applied to a chart, this indicator displays fours dotted-line plots overlaid on the price data.