 Moving Average Gap Ratio (Indicator)
Input Information
| Name | Expression | Default | Description |
| Price | Numeric | Close | Value to be used in calculating the moving averages and percentages. |
| SmoothingType | Numeric | 1 | Set to 1 to use a simple average when calculating the simple moving average; otherwise set to 2 to use an exponential average for smoothing. |
| FastLength | Numeric | 5 | Number of bars to include in calculating the shorter length (fast) average. |
| MedLength | Numeric | 25 | Number of bars to include in calculating the medium length (med) average. |
| SlowLength | Numeric | 75 | Number of bars to include in calculating the longer length (slow) average. |
| PlotFastPctInCharting | Numeric | 1 | In charting, set to 1 to display the percentage of price from the fast moving average; otherwise set to 0 to not display. |
| PlotMedPctInCharting | Numeric | 1 | In charting, set to 1 to display the percentage of price from the medium moving average; otherwise set to 0 to not display. |
| PlotFastPctInCharting | Numeric | 1 | In charting, set to 1 to display the percentage of price from the slow moving average; otherwise set to 0 to not display. |
Market Synopsis
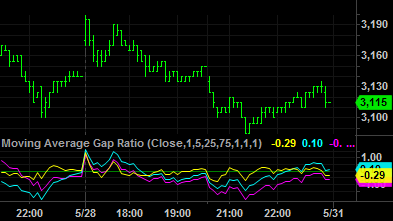
The Moving Average Gap Ratio indicator calculates and plots the percentage difference between the Price and the fast, medium, and slow moving averages for the most recent number of bars as specified by each moving average Length input. For example, the default setting is to calculate and plot the percent change based on the average of the closing prices of the last 5 bars, the last 25 bars and the last 75 bars. The shorter (also known as faster) the length of an average the more sensitive it will be to current price changes than longer (slower) averages.
Plot Information
| Number | Name | Default Color | Description |
| Plot1 | Fast% | Yellow | Plots the percent change of the fast moving average. |
| Plot2 | Med% | Cyan | Plots the percent change of the medium moving average. |
| Plot3 | Slow% | Magenta | Plots the percent change of the slow moving average. |
| Plot4 | ZeroLine | Green | Plots a zero reference line. |
When applied to a chart, this indicator displays three plots and a zero reference line in a separate subgraph from the price data.