 Mov Avg Exp Ribbon (Indicator)
Input Information
| Name | Expression | Default | Description |
| Price | Numeric | Close | Moving average calculation price |
| BaseLength | Numeric | 10 | Base moving average length |
| ArithOrGeom_1or2 | Numeric | 1 | Calculation type |
| IncrementOrMultiplier | Numeric | 10 | Used as Length increment if arithmetic type ribbon or as multiplier if geometric type ribbon |
| FastColor | Numeric | Yellow | Color of the fast value |
| SlowColor | Numeric | Red | Color of the slow value |
Market Synopsis
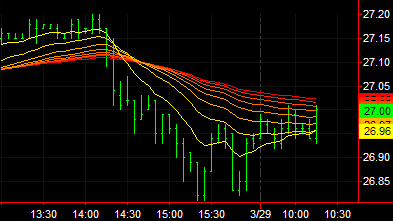
Plots a "Moving Average Ribbon" using the gradient color system - it is created using a series of exponential moving averages of various lengths. The lengths of the averages are calculated based on the length of the first moving average line which is set by the input BaseLength. Each subsequent length is calculated based on the ArithOrGeom_1or2 input.
Plot Information
| Number | Name | Default Color | Description |
| Plot1-8 | XMA1-8 | Gradient | Plots a series of exponential moving averages of various inputs based on specified type of calculation. |
When applied to a chart, this indicator displays eight plots in a separate subgraph from the price data.
Related Function