 Mov Avg Exp 2 Lines (Indicator)
Input Information
| Name | Expression | Default | Description |
| FastPrice | Numeric | Close | Value to be used in calculating the "fast" moving average. |
| SlowPrice | Numeric | Close | Value to be used in calculating the "slow" moving average. |
| FastLength | Numeric | 9 | Number of bars to include in calculating the "fast" average. |
| SlowLength | Numeric | 18 | Number of bars to include in calculating the "slow" average. |
| Displace | Numeric | 0 | Number of bars to displace the plot of the moving averages. |
Market Synopsis
The moving average may be the most widely used indicator. The Mov Avg Exp 2 line indicator calculates and plots two simple exponential moving averages of the same prices, specified by the fast and slow price inputs, from each of the most recent number of bars specified by the fast and slow length inputs. For example, the default setting is to calculate and plot an exponential moving average of the closing prices of the last 9 bars and an exponential moving average of the closing prices of the last 18 bars. The average of shorter length (also known as the fast average) will be more sensitive to current price changes than the average of greater length (also known as the slow average).
Moving averages are generally used for trend identification. Attention is given to the direction in which the averages are moving and to the relative position of prices and the averages. Rising moving average values (direction) and prices above the short moving average and the short moving average above the long moving average (position) would indicate an uptrend. Declining moving average values and prices below the short moving average and the short moving average below the long moving average would indicate a downtrend.
Displaced moving averages plot the moving average values of a previous bar or later bar on the current bar. This indicator is NOT displaced by default. Changing the input Displace to positive number displaces the plot to the left. Changing the input Displace to a negative number displaces the plot to the right.
Plot Information
| Number | Name | Default Color | Description |
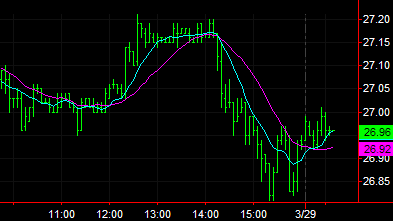
| Plot1 | FastAvg | Cyan | Plots the fast moving average value. |
| Plot2 | SlowAvg | Magenta | Plots the slow moving average value. |
When applied to a chart, this indicator displays two plots in the same subgraph as the price data.