 McClellan Osc (Indicator)
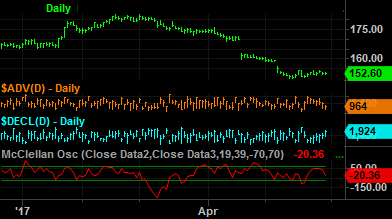
This indicator uses the $ADV symbol as Data2 and the $DECL symbol as Data3.
Input Information\
| Name | Expression | Default | Description |
| AdvIssues | Numeric | Close of Data2 | Price data representing Advancing Issues. |
| DecIssues | Numeric | Close of Data3 | Price data representing Declining Issues. |
| FastLength | Numeric | 19 | Number of bars to include in fast exponential average. |
| SlowLength | Numeric | 39 | Number of bars to include in slow exponential average. |
| OverSold | Numeric | -70 | Value to represent the oversold level. |
| OverBought | Numeric | 70 | Value to represent the overbought level. |
Market Synopsis
The McClellan Oscillator calculates the difference between Advancing Issues and Declining Issues, and then calculates two exponential averages of this difference. The difference between the 2 averages is then calculated and plotted on the chart. The difference between advancing issues and declining issues is known as market breadth. For example, if a stock market index is rallying but there are more issues declining than advancing, then the rally is narrow and much of the stock market is not participating.
The McClellan Oscillator uses averages and differences based on this data to gauge market breadth. To plot the McClellan Oscillator accurately, the chart must contain both the Advancing Issues and the Declining Issues and the inputs must specify the correct DataN number for each. Because the McClellan Oscillator uses exponential averages, the numeric value of the McClellan Oscillator will depend on the data available in the chart.
Plot Information
| Number | Name | Default Color | Description |
| Plot1 | McClOsc | Red | Plots the McClellan Oscillator value. |
| Plot2 | OverBot | Dark Green | Plots the overbought reference line. |
| Plot3 | OverSld | Dark Green | Plots the oversold reference line. |
When applied to a chart, this indicator displays three plots in a separate subgraph from the price data.