 Mass Index (Indicator)
Input Information
| Name | Expression | Default | Description |
| SmoothingLength | Numeric | 9 | Number of bars used for the Mass Index exponential moving average. |
| SummationLength | Numeric | 25 | Number of bars used for the second Mass Index exponential moving average. |
| Setup | Numeric | 27 | Value signifying a Setup of a possible trend reversal. |
| Trigger | Numeric | 26.5 | Value, following a Setup, signifying a reversal (reversal bulge). |
Market Synopsis
The Mass Index uses the range of the bars to calculate several values, including exponential averages of the ranges. It then calculates and plots an index of these calculations. The Mass Index is used in trending markets to monitor direction and warn of potential changes in market direction.
The Mass Index indicates a possible price reversal when the Mass Index line crosses above the setup line and subsequently falls below the trigger line. This is known as a reversal bulge. The Mass Index does not identify the trend direction, but rather warns of possible reversals.
Plot Information
| Number | Name | Default Color | Description |
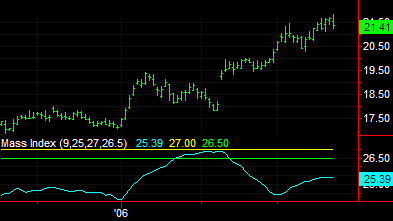
| Plot1 | MassX | Cyan | Plots the Mass Index value. |
| Plot2 | Setup | Yellow | Plots the Setup value. |
| Plot3 | Trigger | Green | Plots the Trigger value. |
When applied to a chart, this indicator displays three plots in a separate subgraph from the price data.