 Market Depth - Price Levels (Indicator)
Input Information
There are no inputs available for this indicator.
Market Synopsis
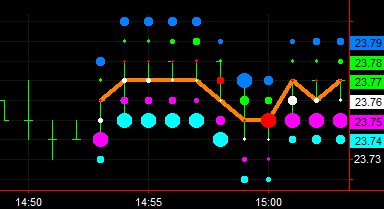
The Market Depth - Price Levels indicator plots dots on the price bars of a chart (real-time only). Six colored dots are plotted at the three inside bid levels and the three inside offer levels. The size of the dots reflects the relative size of the bid or offer at each dot's price level. For example, if the size of bid level 1 is the largest of all the bid and offer levels, then the dot at that level (magenta) will be the largest of the six dots. The second largest dot represents the next largest bid or offer level, etc.
The Market Depth - Price Levels indicator makes use of a MarketDepthProvider object that provides real-time access to multiple levels of market depth data for the selected symbol (in this case the current chart or grid row symbol).
This study is intended to plot only in real-time, when live market data is flowing. It is not intended to plot on historical bars.
Plot Information
| Number | Name | Default Color | Description |
| Plot1 | Bid 2 | Cyan | The relative number of bids at price level 2. |
| Plot2 | Bid 1 | Magenta | The relative number of bids at price level 1. |
| Plot3 | Bid 0 | White | The relative number of bids at price level 0. |
| Plot4 | Ask 0 | Red | The relative number of offers at price level 0. |
| Plot5 | Ask 1 | Green | The relative number of offers at price level 1. |
| Plot6 | Ask 2 | Light Blue | The relative number of offers at price level 2. |
| Plot7 | Close | Orange | The Last trade price. |
| Plot8 | DataState | Yellow | The load state of the market depth provider data object. |
In RadarScreen, a DataState status string is shown along with the size of the three inside bid levels, three inside offer levels, and the Last traded price.
Related