 Line at Price (Indicator)
Input Information
| Name | Expression | Default | Description |
| LineValue | Numeric | Close | Value at which to plot the horizontal line. |
| LineColor | Numeric | Green | Color to use for the horizontal line. |
| LineStyle | String | "Solid" | Style to use for the horizontal line. Example: "dashed". Valid values include “dashed”, “dashed2”, “dashed3”, “dotted”, and “solid”. If an invalid string is used, the line will be solid. |
| LineWeight | Numeric | 0 | Weight (thickness) of the horizontal line (0 to 6). |
| PercentTransparency | Numeric | 25 | Transparency of the horizontal line (0 to 100). 0 is fully opaque. 100 is fully transparent. |
| LineLabelLeftOrRightJustified | Numeric | 0 | Controls justification (right or left) of the line label, if show (see below). A value of 0 will show the label on the left side of the horizontal line and a value of 1 will show the label on the right side of the horizontal line. |
| HideOrShowLineLabel | Numeric | 1 | Controls whether or not the line label is shown. A value of 1 will show the label on the horizontal line, and a value of 0 will not show the label. |
| TextFontSize | Numeric | 9 | Font size used for the line label. |
Market Synopsis
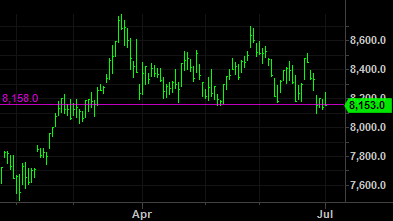
The Line At Price indicator draws a horizontal line object at the price level set by the LineValue input. This input value can be any numeric EasyLanguage expression, but should NOT be a quote field like InsideBid, InsideAsk, since the input is only evaluated and updated on a trade tick and, therefore, the current quote field value may not be plotted (i.e., the input has not been assigned the current quote field value). For example, this input can be
- A historical price such as Open, High, Low, Close, etc.
- A value or price calculated in a function (e.g., MedianPrice, Average(Close, 10), etc.
- A formula (e.g., to draw the horizontal line at a price 10% below the Close, you can enter "Close * 0.90" in the input).
The horizontal line is automatically replotted at the current LineValue as the chart updates. This indicator is only available for in Chart Analysis.
Plot Information
Note that this indicator uses a HorizontalLine drawing object (EL object class) to plot the horizontal line instead of an EasyLanguage plot statement.
The study can also plot the line in a subgraph as set by its scaling properties and the study inputs. For example, if the “RSI” indicator is plotted in subgraph 2 (with a price input of Close and a Length of 14) and it is desired to plot a horizontal line at the current RSI value in the subgraph with the RSI indicator:
- Set the 'LineValue' input to “RSI( Close, 14 )” (without the quotes) (the same price and length as the RSI indicator)
- When the indicator is inserted, select the scaling tab for the study:
- Set the "Scale On" value to Right Axis
- Set the "Sub-graph" to the same subgraph that the RSI is plotted in (2 in this example)