 Line at Last (Indicator)
Input Information
| Name | Expression | Default | Description |
| LineColor | Numeric | MyColors( “Orange” ) | Color to use for the horizontal line. |
| LineStyle | String | "Solid" | Style to use for the horizontal line. Example: "dashed". Valid values include “dashed”, “dashed2”, “dashed3”, “dotted”, and “solid”. If an invalid string is used, the line will be solid. |
| LineWeight | Numeric | 0 | Weight (thickness) of the horizontal line (0 to 6). |
| PercentTransparency | Numeric | 25 | Transparency of the horizontal line (0 to 100). 0 is fully opaque. 100 is fully transparent. |
| LineLabelLeftOrRightJustified | Numeric | 0 | Controls justification (right or left) of the line label, if show (see below). A value of 0 will show the label on the left side of the horizontal line and a value of 1 will show the label on the right side of the horizontal line. |
| HideOrShowLineLabel | Numeric | 1 | Controls whether or not the line label is shown. A value of 1 will show the label on the horizontal line, and a value of 0 will not show the label. |
| TextFontSize | Numeric | 9 | The point size of the desired font used for the line label. Example: Set to 10 for a 10 point font. |
| HiAlert | Numeric | 1000000 | Last price at or above which an alert will be triggered. |
| LoAlert | Numeric | 1 | Last price at or below which an alert will be triggered. |
Market Synopsis
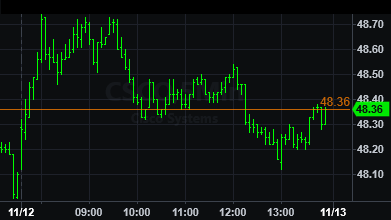
The Line at Last indicator draws a horizontal line object at the Last price.
The horizontal line is automatically replotted at the Last price as the price changes. This indicator is only available for in Chart Analysis. If a valid Last price is not available, no line will be shown.
Plot Information
Note that this indicator uses a HorizontalLine drawing object (EL object class) to plot the horizontal line instead of an EasyLanguage plot statement.
Related