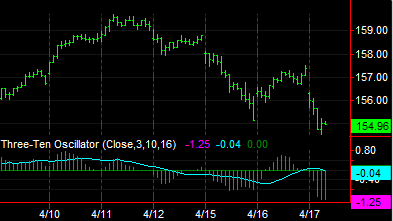
LBR Three-Ten Oscillator (Indicator)
Input Information
| Name | Expression | Default | Description |
| Price | Numeric | Close | Value to be used in calculating the moving averages. |
| FastLength | Numeric | 3 | Number of bars to include in calculating the "fast" average. |
| SlowLength | Numeric | 10 | Number of bars to include in calculating the "slow" average. |
| SmoothingLength | Numeric | 16 | Number of bars to smooth the moving average difference. |
| UseNormalOrAlternate_1_or_0 | Numeric | 1 | Specify 1 for the normal calculation, or 0 for the alternate calculation of the oscillator. |
Market Synopsis
Compares a fast moving average line to a slow moving average histogram.
Plot Information
| Number | Name | Default Color | Description |
| Plot1 | FastLine | Cyan | Plots the fast moving average value as a line. |
| Plot2 | SlowLine | Magenta | Plots the slow moving average value as a histogram. |
| Plot3 | ZeroLine | DarkGreen | Plots zero reference line. |
When applied to a chart, this indicator displays plots in a separate subgraph from the price data.