 KST (Indicator)
Input Information
| Name | Expression | Default | Description |
| Price | Numeric | Close | Price expression to use in calculating the KST value. |
| ROCLength1 | Numeric | 10 | Number of bars to use in the first Rate of Change calculation. |
| ROCLength2 | Numeric | 15 | Number of bars to use in the second Rate of Change calculation. |
| ROCLength3 | Numeric | 20 | Number of bars to use in the third Rate of Change calculation. |
| ROCLength4 | Numeric | 30 | Number of bars to use in the fourth Rate of Change calculation. |
| AvgLength1 | Numeric | 10 | Number of bars to use in smoothing the first Rate of Change. |
| AvgLength2 | Numeric | 10 | Number of bars to use in smoothing the second Rate of Change. |
| AvgLength3 | Numeric | 10 | Number of bars to use in smoothing the third Rate of Change. |
| AvgLength4 | Numeric | 15 | Number of bars to use in smoothing the fourth Rate of Change. |
| Weight1 | Numeric | 1 | Weighting value used to weight the average of the first Rate of Change. |
| Weight2 | Numeric | 2 | Weighting value used to weight the average of the second Rate of Change. |
| Weight3 | Numeric | 3 | Weighting value used to weight the average of the third Rate of Change. |
| Weight4 | Numeric | 4 | Weighting value used to weight the average of the fourth Rate of Change. |
| SignalAvgLength | Numeric | 9 | Number of bars to use in smoothing the KST value to create the Signal Line. |
| SignalOrExpMA | Numeric | 0 | Determines the smoothing type to be used. A value of 0 will smooth values using simple moving average, and a value of 1 will smooth values using exponential moving average. |
Market Synopsis
KST is an abbreviation for “Know Sure Thing”. This indicator is used to help identify the major trend cycles/moves, while attempting to minimize whipsaws. The indicator assumes that price trends are dependent on many different time cycles and that long-term trend reversals take place when several time frame price trends are simultaneously changing.
The calculation uses 4 different rate of change calculations, each being smoothed and then weighted to result in a single plot (KST). The weighting applies more weight to the longer time frames to aid in better identification of the primary market swings.
Plot Information
| Number | Name | Default Color | Description |
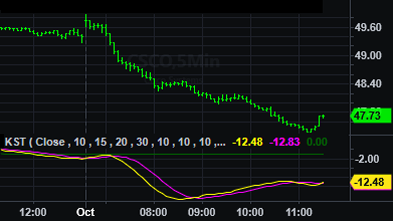
| Plot1 | KST | Yellow | Plots the KST value. |
| Plot2 | SigLine | Magenta | Signal line (smoothed KST value). |
| Plot3 | ZeroLine | Dark Green | Zero reference line. |
When applied to a chart, this indicator displays three plots in a separate subgraph from the price data.
Related Functions
Average, XAverage, RateOfChange
Reference: Martin J. Pring, "Technical Analysis Explained" (Third Edition) (McGraw-Hill, Inc., 1991).