 Keltner Channel (Indicator)
Input Information
| Name | Expression | Default | Description |
| Price | Numeric | Close | Price used to calculate the midline. |
| Length | Numeric | 20 | Length used to calculate the midline. |
| NumATRs | Numeric | 1.5 | Multiple of the average true range used to determine the Keltner Channel bands. |
| Displace | Numeric | 0 | The number of bars to displace the plot of the Keltner Channel bands. |
Market Synopsis
The Keltner Channel indicator is used to identify overbought / oversold conditions as well as the trend strength of a market. When an asset's price is closer to the upper band than the lower band, the market is considered overbought. Conversely, when an asset's price is closer to the bottom band than the upper band, the market is considered oversold. An advantage of Keltner Channel analysis compared to other indicators used to analyze trend strength is that market lag is not as pronounced because Keltner Channels are extremely sensitive to fluctuations in volatility.
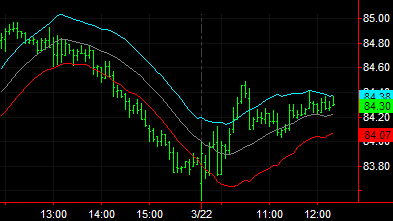
Plot Information
| Number | Name | Default Color | Description |
| Plot1 | LowerBand | Cyan | Plots the lower Keltner Channel band as a line. |
| Plot2 | UpperBand | Red | Plots the upper Keltner Channel band as a line. |
| Plot3 | MidLine | Dark Gray | Plots the central moving average as a line. |
When applied to a chart, this indicator contains three plots, displayed in the same subgraph as the price data.