 Golden Cross (Indicator)
Input Information
| Name | Expression | Default | Description |
| Price | Numeric | Close | Value used in calculating the moving averages. |
| FastLength | Numeric | 5 | Bars used for the fast (shorter) moving average. |
| SlowLength | Numeric | 25 | Bars used for the slow (longer) moving average. |
| AlertIfRecent | Numeric | 1 | When 1, trigger an alert if a golden cross occurs over the specified number of bars (see next input). |
| AlertIfBarsSinceCrossLessThan | Numeric | 1 | Bars used to determine is a golden cross occurred fewer than N bars ago. |
| AlertIfImminent | Numeric | 1 | When 1, trigger an alert if the fast moving average is below the slow moving average by a specified percentage (see next input). |
| ImminentPercentageMax | Numeric | 3 | Percent used to determine if the difference between the two moving averages indicates an imminent cross. |
| PlotPrice | Numeric | MedianPrice | The price location on a bar at which the marker (dot) is plotted when a golden cross occurs. |
| ColorCellBGOnAlert | TrueFalse | True | True to change the background color of a RS cell when an alert occurs. False to leave the cell background color unchanged. |
| BackgroundColorAlertCell | Numeric | DarkGray | The color of the RS cell background to use with the above input. |
Market Synopsis
The Golden Cross indicator marks each bar where the short (fast) moving average crosses above the long (slow) moving average. This is typically used to identify the beginning of a bullish trend. May also be combined with a high trade volume to confirm the strength of the trend. It is available for Chart Analysis and RadarScreen.
Plot Information
| Number | Name | Default Color | Description |
| Plot1 | G-Crs | Magenta | Plots a marker on a bar when the fast moving average crosses over the slow moving average. In RadarScreen, this plot is the number of bars ago that the cross occurred. |
| Plot2 | G-CrsTime | Cyan | Plots the bar time stamp (as a string) when an alert occurs for the bar where the last cross occurred. |
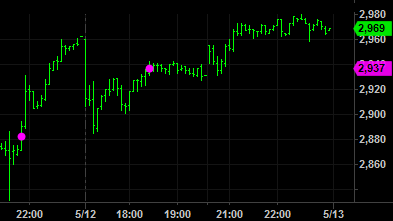
When applied to a chart, this indicator plots a dot on the specified price point on each bar where a Golden Cross occurs.