 Floor Trader Pivots Ex (Indicator)
Input Information
| Name | Expression | Default | Description |
| PivotCalcType | Numeric | 1 | Pivot Calculation Type. Enter 1 for Classic pivots; enter 2 for Traditional pivots; enter 3 for Camarilla pivots. |
| PivotInterval | Numeric | 1 | Enter 1 for Daily pivots; enter 2 for Weekly pivots, enter 3 for Monthly pivots, enter 4 for Quarterly pivots, enter 5 for Yearly pivots. |
| ShowPivotLabels | Numeric | 1 | Enter 1 to show text labels for the pivot levels. Enter 0 to not show text labels. |
| ShowCurrentPeriodLabelsOnly | Numeric | 1 | Enter 1 to show text labels for the current period only. Enter 0 to show text labels for all pivot levels. |
| ShowPriceLevelsInLabels | Numeric | 1 | Enter 1 to include the pivot price values in the text labels. Enter 0 to not include pivot price values. |
| ShowPivotIntervalInLabels | Numeric | 1 | Enter 1 to show the pivot interval in the text labels. Enter 0 to not show the pivot interval. |
| PercentTransparency | Numeric | 0 | Enter the desired percentage transparency of the text labels (0 = solid, 100 = clear). |
| R5Color | Numeric | Red | Enter the color to use for the R5 pivot plot and associated text label. |
| R4Color | Numeric | MyColors( "OrangeRed" ) | Enter the color to use for the R4 pivot plot and associated text label. |
| R3Color | Numeric | MyColors( "Tomato" ) | Enter the color to use for the R3 pivot plot and associated text label. |
| R2Color | Numeric | MyColors( "DarkOrange" ) | Enter the color to use for the R2 pivot plot and associated text label. |
| R1Color | Numeric | MyColors( "Orange" ) | Enter the color to use for the R1 pivot plot and associated text label. |
| PivotColor | Numeric | MyColors( "NavajoWhite" ) | Enter the color to use for the pivot point plot and associated text label. |
| S1Color | Numeric | MyColors( "PaleGreen" ) | Enter the color to use for the S1 pivot plot and associated text label. |
| S2Color | Numeric | MyColors( "SpringGreen" ) | Enter the color to use for the S2 pivot plot and associated text label. |
| S3Color | Numeric | MyColors( "LimeGreen" ) | Enter the color to use for the S3 pivot plot and associated text label. |
| S4Color | Numeric | MyColors( "Lime" ) | Enter the color to use for the S4 pivot plot and associated text label. |
| S5Color | Numeric | Green | Enter the color to use for the S5pivot plot and associated text label. |
| ShowR5 | Numeric | 1 | Enter 1 to plot the R5 pivot level and draw the associated text label (if text labels are set to show); enter 0 to not plot the pivot value. |
| ShowR4 | Numeric | 1 | Enter 1 to plot the R4 pivot level and draw the associated text label (if text labels are set to show); enter 0 to not plot the pivot value. |
| ShowR3 | Numeric | 1 | Enter 1 to plot the R3 pivot level and draw the associated text label (if text labels are set to show); enter 0 to not plot the pivot value. |
| ShowR2 | Numeric | 1 | Enter 1 to plot the R2 pivot level and draw the associated text label (if text labels are set to show); enter 0 to not plot the pivot value. |
| ShowR1 | Numeric | 1 | Enter 1 to plot the R1 pivot level and draw the associated text label (if text labels are set to show); enter 0 to not plot the pivot value. |
| ShowPP | Numeric | 1 | Enter 1 to plot the pivot point level and draw the associated text label (if text labels are set to show); enter 0 to not plot the pivot value. |
| ShowS1 | Numeric | 1 | Enter 1 to plot the S1 pivot level and draw the associated text label (if text labels are set to show); enter 0 to not plot the pivot value. |
| ShowS2 | Numeric | 1 | Enter 1 to plot the S2 pivot level and draw the associated text label (if text labels are set to show); enter 0 to not plot the pivot value. |
| ShowS3 | Numeric | 1 | Enter 1 to plot the S3 pivot level and draw the associated text label (if text labels are set to show); enter 0 to not plot the pivot value. |
| ShowS4 | Numeric | 1 | Enter 1 to plot the S4 pivot level and draw the associated text label (if text labels are set to show); enter 0 to not plot the pivot value. |
| ShowS5 | Numeric | 1 | Enter 1 to plot the S5 pivot level and draw the associated text label (if text labels are set to show); enter 0 to not plot the pivot value. |
| TextLabelFontSize | Numeric | 1 | Enter the font size for the text labels on the line |
Market Synopsis
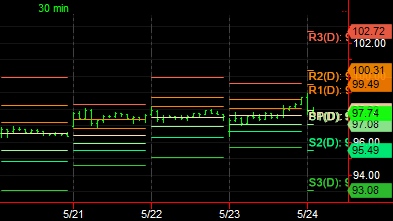
Floor traders, in particular, have long used a calculated value called the Pivot as a price fulcrum. Support and resistance levels may also be calculated from the Pivot.
This indicator can plot Classic, Traditional, or Camarilla pivots. The resistance and support levels plotted depend on the type of pivots (see table below).
The pivots can be set to calculate and plot Daily, Weekly, Monthly, Quarterly (calendar quarter), or Yearly pivots.
Plot Information
| Number | Name | Default Color | Description |
| Plot1 | R5 | See inputs section. | Plotted for Traditional pivots. |
| Plot2 | R4 | See inputs section. | Plotted for Traditional and Camarilla pivots. |
| Plot3 | R3 | See inputs section. | Plotted for all pivot calculation types. |
| Plot4 | R2 | See inputs section. | Plotted for all pivot calculation types. |
| Plot5 | R1 | See inputs section. | Plotted for all pivot calculation types. |
| Plot6 | PP | See inputs section. | Plotted for Classic and Traditional pivots. |
| Plot7 | S1 | See inputs section. | Plotted for all pivot calculation types. |
| Plot9 | S2 | See inputs section. | Plotted for all pivot calculation types. |
| Plot9 | S3 | See inputs section. | Plotted for all pivot calculation types. |
| Plot10 | S4 | See inputs section. | Plotted for Traditional and Camarilla pivots. |
| Plot11 | S5 | See inputs section. | Plotted for Traditional pivots. |
When applied to a chart, this indicator plots in the same subgraph as the price data.