 Fibonacci Retrace (Indicator)
Input Information
| Name | Expression | Default | Description |
| PriceH | Numeric | High | High price used to calculate retracement percentage. |
| PriceL | Numeric | Low | Low price used to calculate retracement percentage. |
| Length | Numeric | 50 | Bars over which to calculate the high and low retrace values. |
| Retrace | Numeric | 0.382 | Percentage amount of retracement as a fraction (0.382 represents 38.2%). |
| ColorCellBGOnAlert | TrueFalse | True | True to change the background color of a grid cell when an alert occurs (see following input). |
| BackgroundColorAlertCell | Numeric | DarkGray | The background color value for a grid cell when an alert occurs (see previous input) |
Market Synopsis
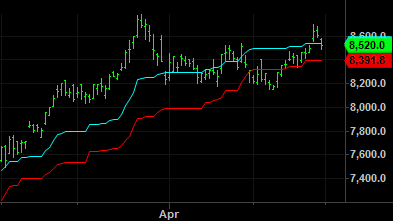
The Fibonacci Retrace indicator calculates and displays the high and low retracement values based on the specified Fibonacci Retrace percentage over Length bars. It is available for Chart Analysis and RadarScreen.
Plot Information
| Number | Name | Default Color | Description |
| Plot1 | HRetrace | Cyan | Plots the high retrace price. |
| Plot1 | LRetrace | Red | Plots the low retrace price. |
| Plot1 | CROSS FIB | Yellow | Displays a message (grid only) when an alert occurs that indicates that whether the bar Close crosses under the high retrace or over the low retrace. |
When applied to a chart, this indicator displays two plots in the same subgraph as the price data.