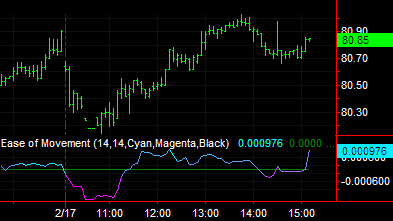
 Ease of Movement (Indicator)

Input Information
| Name | Expression | Default | Description |
| SmoothingLength | Numeric | 14 | Number of bars used to smooth the Ease of Movement calculation. |
| ColorNormLength | Numeric | 14 | Number of bars over which to normalize the indicator for gradient coloring. |
| UpColor | Numeric | Cyan | Color to use for indicator values that are relatively high over ColorNormLength bars. Set to -1 to disable gradient color plotting. |
| DnColor | Numeric | Magenta | Color to use for indicator values that are relatively low over ColorNormLength bars. Set to -1 to disable gradient color plotting. |
| GridForegroundColor | Numeric | Black | Color to use for numbers in RadarScreen cells when gradient coloring is enabled, that is, when both UpColor and DnColor are set to non-negative values. |
Market Synopsis
The Ease of Movement indicator calculates and plots a measure of the relationship between price and volume. For instance, a market that rises on low volume exhibits a high Ease of Movement, generating positive values for this indicator. Negative values are generated when prices move down with light volume. When the indicator is near zero, either prices are not moving or heavy volume is required to move prices.
The Ease of Movement calculation is smoothed by taking an average.
Plot Information
| Number | Name | Default Color | Description |
| Plot1 | EOM | Cyan/Magenta | Plots the Ease of Movement as a line. |
| Plot2 | ZeroLine | Dark Green | Plots a horizontal line at 0. |
When applied to a chart, this indicator displays two plots in a separate subgraph from the price data.
Set either UpColor and/or DnColor to -1 to disable gradient plot coloring. When disabled, Plot1 color is determined by settings in indicator properties dialog box. Plot2 (ZeroLine) color always comes from indicator properties dialog box.