 DMI (Indicator)
Input Information
| Name | Expression | Default | Description |
| Length | Numeric | 14 | Number of bars used to calculate the DMIPlus, DMIMinus, and ADX. |
| ADXTrend | Numeric | 25 | Value used as alert criteria. |
Market Synopsis
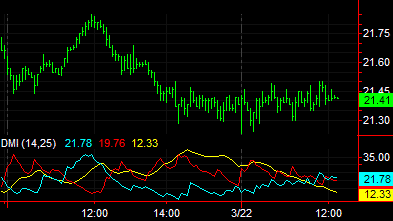
The DMI indicator calculates and plots the DMI Plus and DMI Minus values. DMI Plus is calculated from a comparison of the highs on a series of consecutive bars versus the true range; DMI Minus is calculated from the lows on a series of consecutive bars versus the true range. These values are used to calculate ADX, which is also plotted by this indicator. ADX is commonly used to indicate whether a market is trending.
Rising ADX values indicate a trending market without indication of the trend direction. The DMI Plus and DMI Minus, components of the ADX, can aid in identifying direction. DMI Plus crossing over DMI Minus is a bullish sign, and vice versa.
Plot Information
| Number | Name | Default Color | Description |
| Plot1 | DMI+ | Cyan | Plots the DMIPlus as a line. |
| Plot2 | DMI- | Red | Plots the DMIMinus as a line. |
| Plot3 | ADX | Yellow | Plots the ADX as a line. |
When applied to a chart, this indicator displays three plots in a separate subgraph from the price data.