 Day or Session Hi-Lo Lines (Indicator)
Input Information
| Name | Expression | Default | Description |
| UseSessionOrDateChange_0_or_1 | Numeric | 0 | Specify whether number of days ago refers to regular session (=0) or full day (=1). |
| IncludeCurrentDay | TrueFalse | False | True to include the current day's High and Low in the highest/lowest calculation, otherwise False to not include. |
| Numdays | Numeric | 3 | The number of days ago to reference. |
Market Synopsis
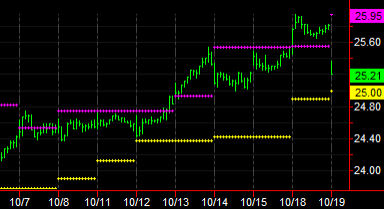
The Day or Subsession Hi-Lo Lines indicator plots a channel of the highest daily or session high and the lowest daily or session from a specified number of days ago based on tick or intraday data. By default, it's set to plot the high and low of the regular session of 3 days ago.
Plot Information
| Number | Name | Default Color | Description |
| Plot1 | SubSessHigh | Magenta | The high price of N periods ago. |
| Plot2 | SubSessLow | Yellow | The low price of N periods ago. |
Related Function