 Day Open-Hi-Lo Lines (Indicator)
Input Information
| Name | Expression | Default | Description |
| OpenColor | Numeric | Red | Color to draw the line representing the Open price |
| HighColor | Numeric | Yellow | Color to draw the line representing the High price |
| LowColor | Numeric | Cyan | Color to draw the line representing the Low price |
Market Synopsis
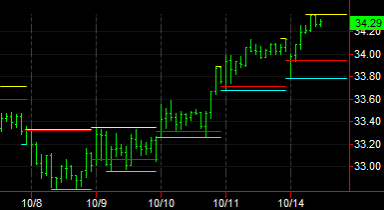
Many traders initiate trades, especially near the open or toward the close, dependent on the action of the price in relation to the day's open. The Day Open-Hi-Lo-Lines indicator is a method of quickly seeing the relationship of the day's open with that of the high and low. Once the day's open has been established, a horizontal line is drawn on the chart equal to the open, and is continually drawn as the price bars are completed. Other horizontal lines representing the high and low of the day are drawn across the chart and updated to equal to the most recent high and low prices. This indicator may only be used with charts plotting intraday data.
This indicator does not contain plot statements, rather it draws horizontal trendlines. The horizontal lines are displayed in the same subgraph as the price data. The default colors are red for the open line, yellow for the high line, and cyan for the low line.
Plot Information
This indicator does use any plot statements. Instead, it displays trendlines at the open, high and low prices of the day.