 Custom 1 Line (Indicator)
Input Information
| Name | Expression | Default | Description |
| Formula | Numeric | Close - Close [10] | Value (any numeric expression) to be plotted. |
| Displace | Numeric | 0 | The number of bars to displace the indicator plot. |
| AlertCondition | True/False | False | True/False expression used to define the alert criteria. |
| AlertMessage | String | "" | Custom text to be displayed when alerts are triggered. |
Market Synopsis
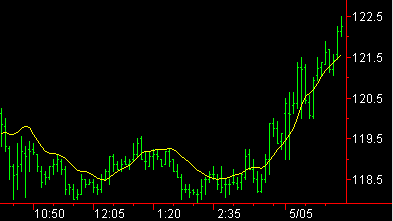
The Custom 1 Line indicator calculates and plots the value of the numeric expression specified by the input Formula. This is designed to allow you to plot any value, that is, the result of any calculation you choose, simply by editing the input in the Customize Indicator dialog. To get you started, the default setting for Formula is the Close. You may substitute any expression that results in a number, for example "range" or "close - close of 3 bars ago". You may also use functions in the expression. Additionally, this indicator will generate an alert as specified by the input AlertCondition. This input must be an expression that is either true or false, for example "range > range of 1 bar ago". The default plot settings are to plot the value in the same subgraph as the price chart. This may also be modified in the Customize Indicator dialog.
Plot Information
| Number | Name | Default Color | Description |
| Plot1 | PLOT1 | Yellow | Plots the value returned by Formula. |
When applied to a chart, this indicator displays one plot in the same subgraph as the price data.