 Cup with Handle Pattern (Indicator)
Input Information
| Name | Expression | Default | Description |
|
PivotHighPrice |
High |
EasyLanguage expression used for pivot high determination. |
|
|
PivotLowPrice |
Numeric |
Low |
EasyLanguage expression used for pivot low determination. |
|
PivotHigh1LeftStrength |
Numeric |
3 |
For the first pivot high of the pattern, the number of bars to the left of the current bar to be analyzed to see if the price of those bars is less than the price of the current bar. |
|
PivotHigh1RightStrength |
Numeric |
7 |
For the first pivot high, the number of bars to the right of the current bar to be analyzed to see if the price of those bars is less than the price of the current bar. |
|
PivotLow1LeftStrength |
Numeric |
7 |
For the first pivot low, the number of bars to the left of the current bar to be analyzed to see if the price of those bars is greater than the price of the current bar. |
|
PivotLow1RightStrength |
Numeric |
7 |
For the first pivot low, the number of bars to the right of the current bar to be analyzed to see if the price of those bars is greater than the price of the current bar. |
|
PivotHigh2LeftStrength |
Numeric |
7 |
For the second pivot high, the number of bars to the left of the current bar to be analyzed to see if the price of those bars is less than the price of the current bar. |
|
PivotHigh2RightStrength |
Numeric |
3 |
For the second pivot high, the number of bars to the right of the current bar to be analyzed to see if the price of those bars is less than the price of the current bar. |
|
PivotLow2LeftStrength |
Numeric |
3 |
For the second pivot low, the number of bars to the left of the current bar to be analyzed to see if the price of those bars is greater than the price of the current bar. |
|
PivotLow2RightStrength |
Numeric |
3 |
For the second pivot low, the number of bars to the right of the current bar to be analyzed to see if the price of those bars is greater than the price of the current bar. |
|
ATRLength |
Numeric |
30 |
The number of bars to use in the moving average of true range. |
|
MaxBarsBetweenPivotHighs |
Numeric |
65 |
The maximum allowed bars between the pattern pivot highs to validate the pattern. |
|
MaxBarsBetween3rdAnd4thPivots |
Numeric |
10 |
The maximum allowed bars between the 3rd and 4th pattern pivots to validate the pattern. |
|
PivotHighDeltaATRMax |
Numeric |
1 |
The maximum number of ATRs (used as a price difference) allowed between the pivot high prices to validate the pattern. |
|
MaxBarsForTrendlineBreak |
Numeric |
20 |
The maximum number of bars to draw the trendline and monitor for a break of the trendline. |
|
HandleMaxRetracementPercent |
Numeric |
33 |
The maximum allowed percent retracement from the top of the cup (“rim”) to the bottom of the cup for the handle. |
|
CupShapeFactor |
Numeric |
0.9 |
The shape factor for plotting the cup. |
|
HandleShapeFactor |
Numeric |
0.85 |
The shape factor for plotting the handle. |
|
ShowPatternPivotLabels |
Numeric |
0 |
Enter 1 to show text labels for the pivot levels. Enter 0 to not show text labels. |
|
TextLabelFontColor |
Numeric |
MyColors( "LightBlue" ) |
The font color for the text labels. |
|
TextLabelFontSize |
Numeric |
8.0 |
The font size for the text labels. |
|
RimLineThickness |
Numeric |
1 |
The desired thickness for the pattern rim line (drawn as trendlines). Valid values are between 0 and 6. |
|
RimLineColorNoBreakout |
Numeric |
Yellow |
The color used for the horizontal line (drawn with a trendline) at cup's rim when there is no breakout of price above the rim. |
|
RimLineColorBreakout |
Numeric |
MyColors( "LightBlue" ) |
The color used for the horizontal line (drawn with a trendline) at cup's rim when there is a breakout of price above the rim. |
|
RimLineColorTransparency |
Numeric |
0 |
Desired percentage transparency of the rim trendlines. Valid values are between 0 and 100. |
|
ProfitZoneFillColorTransparency |
Numeric |
75 |
The desired percentage transparency of the profit zone rectangle fill color. Valid values are between 0 and 100. |
|
ProfitZoneOutlineColor |
Numeric |
MyColors( "LightBlue" ) |
The outline color to be used for the profit zone rectangle. |
|
ProfitZoneFillColor |
Numeric |
MyColors( "LightBlue" ) |
The fill color to be used for the profit zone rectangle. |
|
NumATRsforProfitZoneHeight |
Numeric |
1 |
The number of ATRs to be used to determine the 'height' of the profit zone rectangle. |
|
MaxDurationBarsForProfitZone |
Numeric |
60 |
The maximum number of bars that the profit zone rectangle will be drawn. |
|
BreakoutDotPlotOffsetTicks |
Numeric |
1 |
The number of price ticks to offset the breakout dot from the trendline value. |
Market Synopsis
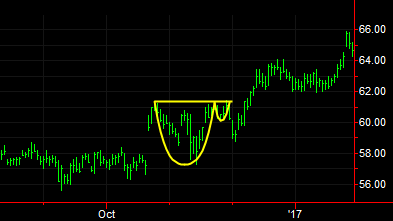
This study identifies "cup with handle" patterns on a chart. This pattern can be considered either a trend continuation or trend reversal pattern and thus, no attempt to identify price trend is used in the indicator. The pattern is composed of a pivot high (PH1), then a pivot low (PL1), following by another pivot high (PH2), and lastly followed by another pivot low (PL2). For more information on the requirements for the pivots and validation of the pattern, see the code commentary in the indicator.
Once the pattern is confirmed, a trendline is drawn from the PH1 bar and is extended to the right at the “rim" price. The "rim" price is the higher of the PH1 or PH2 prices. Also, the “cup” and “handle” are plotted.
The trendline will be truncated if 1) the closing price of a bar crosses over it; or 2) a max number of bars is reached after PL2 (set by inputs) with no break above the trendline.
If the closing price crosses over the trendline, the trendline is truncated on that bar, a dot marker is plotted indicating the breakout, the trendline color is changed to the value in the “RimLineColorBreakout” input, and a profit zone rectangle is drawn. The "target price" for the pattern is the furthest side of the rectangle from the pattern and is at a price equal to the rim price plus the distance between the rim of the cup and the bottom of the cup.
For example: If the rim of the cup is at $25 and the bottom of the cup is at $15, and breakout is to the upside on a crossing of the $25 level, the furthest side of the rectangle will be at $35 ($25 + ($25 - $15)).
The Profit Zone Rectangle will be truncated if 1) the High of a bar equals or exceed the top side of the rectangle (which is the target price) or 2) a maximum number of bars is reached (set by inputs).
Plot Information
The study plots the cup with handle pattern and a marker on the bar that penetrates one of the pattern trendlines.
When applied to a chart, this indicator plots in the same subgraph as the price data.
|
Number |
Name |
Default Color |
Description |
|
Plot1 |
HandleRight |
Yellow |
Plots the right portion of the pattern handle. |
|
Plot2 |
HandleLeft |
Yellow |
Plots the left portion of the pattern handle. |
|
Plot3 |
CupRight |
Yellow |
Plots the right portion of the pattern cup. |
|
Plot4 |
CupLeft |
Yellow |
Plots the left portion of the pattern cup. |
|
Plot5 |
TLBreak |
Magenta |
Plots a dot on the bar where the closing price crossed over the rim trendline. |