 Correlation (Indicator)
Input Information
| Name | Expression | Default | Description |
| IndepData | Numeric | Close of Data1 | First price series for the Correlation study. |
| DepData | Numeric | Close of Data2 | Second price series for the Correlation study. |
| Length | Numeric | 14 | Number of bars to include in study. |
| PosCorrAlert | Numeric | .7 | Positive correlation value that will generate an alert. |
| NegCorrAlert | Numeric | -.7 | Negative correlation value that will generate an alert. |
Market Synopsis
The Correlation indicator calculates the frequency of price movement in the same direction and in opposite directions for 2 markets during the number of bars specified by the input Length. This frequency is indexed and plotted as a value between 1 and -1. This is used as a measure of the tendency of two markets to move in the same direction.
A positive Correlation value indicates that the 2 markets tend to move in the same direction. A negative Correlation value indicates a strong tendency for the 2 markets to move in opposite directions. A Correlation value of near 0 indicates there is very little correlation between the two markets.
Plot Information
| Number | Name | Default Color | Description |
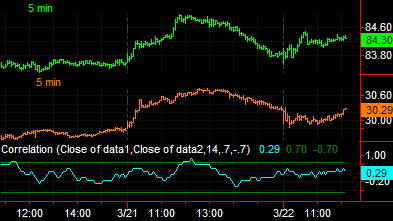
| Plot1 | Correl | Cyan | Plots the Correlation value. |
| Plot2 | PosCorrAlert | Dark Green | Plots the positive alert value. |
| Plot3 | NegCorrAlert | Dark Green | Plots the negative alert value. |
| Plot4 | ZeroLine | Dark Green | Plots a zero reference line. |
When applied to a chart, this indicator displays two plots in a separate subgraph from the price data.