 Chande Momentum Osc (Indicator)
Input Information
| Name | Expression | Default | Description |
| Length | Numeric | 20 | Number of bars to use in calculation. |
| AvgLength | Numeric | 10 | Calculates a simple moving avg for CMO. |
| OverBought | Numeric | 50 | Sets the reference value for over bought. |
| OverSold | Numeric | -50 | Sets the reference value for over sold. |
| ColorCellBGOnAlert | TrueFalse | True | Change cell background color when true, otherwise false. |
| BackgroundColorAlertCell | Numeric | DarkGray | Color of cell background to use if above value is True. |
Market Synopsis
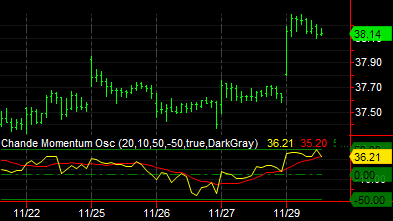
The Chande Momentum Osc indicator plots the difference between the sum of upward momentum (recent gains) and the sum of downward momentum (recent losses) divided by the sum of all price movement over the period. It is considered bullish when the oscillator crosses above overbought and bearish when it crosses below oversold.
Plot Information
| Number | Name | Default Color | Description |
| Plot1 | CMOValue | Yellow | Plots the CMO value. |
| Plot2 | CMOAvg | Red | Plots the average CMO over AvgLength. |
| Plot3 | ZeroLine | DarkGreen | Plots a zero reference line. |
| Plot4 | OverSold | DarkGreen | Plots a zero reference line. |
| Plot5 | ZeroLine | DarlGreen | Plots a zero reference line. |
When applied to a chart, this indicator displays lines in a separate subgraph from the price data.