 Bollinger Bandwidth (Indicator)
Input Information
| Name | Expression | Default | Description |
| BollingerPrice | Numeric | Close | Price on which the calculation of the bands is based. |
| Length | Numeric | 20 | Number of bars of data to be considered. |
| NumDevsUp | Numeric | 2 | Number of standard deviations used to calculate the upper Bollinger Band. |
| NumDevsDn | Numeric | -2 | Number of standard deviations used to calculate the lower Bollinger Band. |
| BulgeLength | Numeric | 50 | Number of bars for calculating the upper channel. |
| SqueezeLength | Numeric | 50 | Number of bars for calculating the lower channel. |
| BackgroundColorAlertCell | Numeric | DarkGrey | Color for RadarScreen cell background when alert occurs. |
| Displace | Numeric | 0 | Number of bars to displace the plot of the Bollinger Bands. |
Market Synopsis
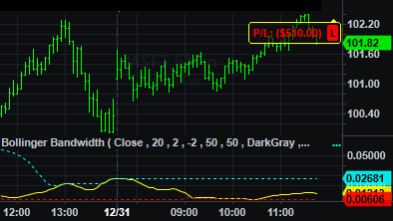
The Bollinger Bandwidth indicator calculates and plots the difference between the upper and lower Bollinger Bands, divided by the value of the moving average that is usually plotted as the middle line between the upper and lower bands.
A higher plotted value indicates that the bands are further apart and a lower plotted value indicates that the bands are closer together.
Plot Information
| Number | Name | Default Color | Description |
| Plot1 | BulgeLine | Cyan | Plots the upper channel line. |
| Plot2 | SqueezeLine | Red | Plots the lower channel line. |
| Plot3 | Bandwidth | Yellow | Plots the Bollinger Bandwidth. |
When applied to a chart, this indicator displays plots in a separate subgraph.