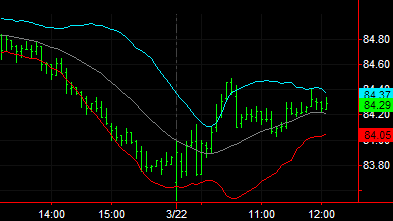
 Bollinger Bands (Indicator)

Input Information
| Name | Expression | Default | Description |
| BollingerPrice | Numeric | Close | Price on which the calculation of the bands is based. |
| TestPriceUBand | Numeric | Close | Used to trigger an alert when this price crosses under UpperBand. |
| TestPriceLBand | Numeric | Close | Used to trigger an alert when this price crosses over LowerBand. |
| Length | Numeric | 20 | Number of bars of data to be considered. |
| NumDevsUp | Numeric | 2 | Number of standard deviations used to calculate the upper Bollinger Band. |
| NumDevsDn | Numeric | -2 | Number of standard deviations used to calculate the lower Bollinger Band. |
| Displace | Numeric | 0 | Number of bars to displace the plot of the Bollinger Bands. |
| ColorPercentB | TrueFalse | True | When true, plots different colors for %B in RadarScreen and other grid apps (see PercentB color ranges below). |
| PercentBVeryHighColor | Numeric | Yellow | Plot color when %B is greater than 100 and ColorPercentB is true. |
| PercentBHighColor | Numeric | Red | Plot color when %B is greater than or equal to 50 and ColorPercentB is true. |
| PercentBLowColor | Numeric | Magenta | Plot color when %B is less than 50 and ColorPercentB is true. |
| PercentBVeryLowColor | Numeric | Cyan | Plot color when %B is less than 0 and ColorPercentB is true. |
Market Synopsis
The Bollinger Bands indicator calculates a simple arithmetic average of prices, specified by the input Price, from each of the most recent number of bars specified by the input Length. This indicator also calculates the standard deviation in those prices for the same number of bars. An upper band is plotted a specified number of standard deviations above this average and a lower band is plotted a specified number of standard deviations below the average. The average is not plotted. Bollinger Bands combine the trend identifying aspects of a moving average with a dynamic factor, each market's own volatility, to plot an envelope. The distance between the bands is, therefore, a reflection of volatility. During sideways periods, prices reaching the bands may indicate overbought or oversold conditions. Strong movement up through the upper band or down through the lower band may indicate the beginning of a trend.
Plot Information
| Number | Name | Default Color | Description |
| Plot1 | UpperBand | Cyan | Plots the upper Bollinger Band as a line. |
| Plot2 | LowerBand | Red | Plots the lower Bollinger Band as a line. |
| Plot3 | MidLine | Dark Gray | Plots the average (midline) as a line. |
| Plot4 | %B | Default | Plots the %B based on the band distance (only in grid apps). |
When applied to a chart, this indicator displays three plots in the same subgraph as the price data. For grids, the indicator displays four plots.