 Bollinger %B (Indicator)
Input Information
| Name | Expression | Default | Description |
| BollingerPrice | Numeric | Close | Price on which the calculation of the Bollinger bands is based. |
| Length | Numeric | 20 | Number of bars of data to be considered. |
| NumDevsUp | Numeric | 2 | Number of standard deviations used to calculate the upper Bollinger Band. |
| NumDevsDn | Numeric | -2 | Number of standard deviations used to calculate the lower Bollinger Band. |
| HiAlert | Numeric | 100 | Value of the high alert. |
| LoAlert | Numeric | 0 | Value of the low alert. |
| ColorPercentB | Boolean | True | True indicates that the following color values are used when plotting %B. |
| PercentBVeryHighColor | Numeric | Yellow | Color used for %B values greater than 100. |
| PercentBHighColor | Numeric | Red | Color used for %B values greater than or equal to 50. |
| PercentBLowColor | Numeric | Magenta | Color used for %B values less than 50. |
| PercentBVeryLowColor | Numeric | Cyan | Color used for %B values less than 0. |
| BackgroundColorAlertCell | Numeric | DarkGray | Background for RadarScreen cell when an alert occurs. |
Market Synopsis
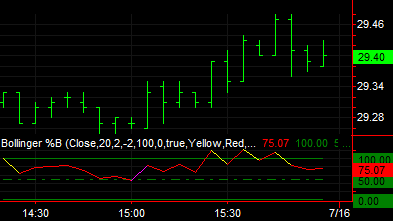
The Bollinger %B indicator shows the relationship between current prices and the upper and lower Bollinger bands (%B = (Close-LowerBand)/(UpperBand - LowerBand). It expresses the current price as a percentage amount, with the distance between the upper and lower bands being considered the 0% to 100% range. The indicator's value can, however, be above 100 or below 0.
Plot Information
| Number | Name | Default Color | Description |
| Plot1 | %B | Cyan | Plots the Bollinger %B value. |
| Plot2 | 100 | Dark Green | Plots an upper reference line at 100. |
| Plot3 | 50 | Dark Green | Plots an middle reference line at 50. |
| Plot4 | 0 | Dark Green | Plots an lower reference line at 0. |
| Plot5 | HiAlert | Light Green | Plots the high alert value. |
| Plot6 | LoAlert | Light Green | Plots the low alert value. |
When applied to a chart, this indicator displays the Bollinger %B value and reference lines in the separate subgraph.