 Average True Range (Indicator)
Input Information
| Name | Expression | Default | Description |
| ATRLength | Numeric | 14 | Number of bars used to calculate the average true range. |
| AlertLength | Numeric | 14 | Number of recent bars used to determine an extreme value of the average true range. |
Market Synopsis
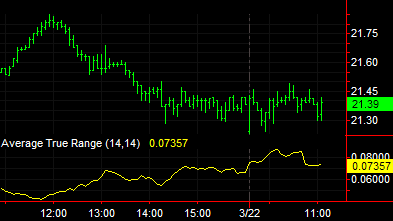
True Range measures the conventional range of a bar but checks the previous bar's closing price to see if it is outside the current bar's range. If it is outside the current bar's range, then that closing price is used instead of the high or low. That is, the previous bar's close is considered part of the current bar's range. This helps account for gaps between bars. The Average True Range indicator calculates and plots the average of these values over a certain number of bars. This indicator may be considered a tool for measuring the volatility of a market using a price range concept. Often, extremes in average true range are associated with a change in character of a market, from trending to trading range and vice versa.
Plot Information
| Number | Name | Default Color | Description |
| Plot1 | ATR | Yellow | Plots the average true range value. |
When applied to a chart, this indicator displays one plot in a separate subgraph from the price data.