 Aroon Oscillator (Indicator)
Input Information
| Name | Expression | Default | Description |
| AroonLength | Numeric | 25 | Number of bars in calculation. |
| ColorCellBGOnAlert | TrueFalse | True | Change cell background color when true, otherwise false. |
| BackgroundColorAlertCell | Numeric | DarkGray | Color of cell background to use if above value is True. |
Market Synopsis
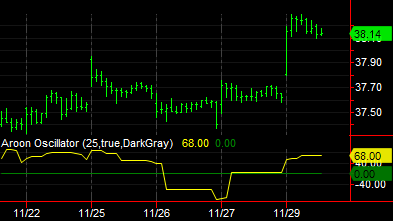
The Aroon indicator plots the difference between the AroonUp and AroonDown values based on Accumulation/Distribution over a specified period divided by the sum of volume for the same period. It is used to determine the amount of buying of selling pressure.
Plot Information
| Number | Name | Default Color | Description |
| Plot1 | AroonOsc | Yellow | Plots the AroonOsc value. |
| Plot2 | ZeroLine | DarkGreen | Plots a zero reference line. |
When applied to a chart, this indicator displays lines in a separate subgraph from the price data.