 Aroon Indicator (Indicator)
Input Information
| Name | Expression | Default | Description |
| AroonLength | Numeric | 25 | Number of bars in calculation. |
| OverBought | Numeric | 70 | Sets the reference value for over bought. |
| OverSold | Numeric | 30 | Sets the reference value for over sold. |
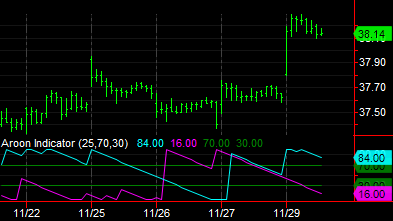
Market Synopsis
The Aroon Indicator plots the AroonUp and AroonDown values based on Accumulation/Distribution over a specified period divided by the sum of volume for the same period. It is used to determine the amount of buying of selling pressure.
Plot Information
| Number | Name | Default Color | Description |
| Plot1 | AroonUp | Cyan | Plots the AroonUp value. |
| Plot2 | AroonDn | Magenta | Plots the AroonDn value. |
| Plot3 | OverBought | DarkGreen | Plots an over bought reference line. |
| Plot4 | OverSold | DarkGreen | Plots an over sold reference line. |
When applied to a chart, this indicator displays lines in a separate subgraph from the price data.