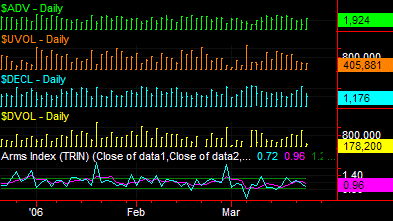
 Arms Index (TRIN) (Indicator)

Input Information
| Name | Expression | Default | Description |
| AdvIssues | Numeric | Close of data1 | Value to consider as Advancing Issues. |
| AdvVol | Numeric | Close of data2 | Value to consider as Advancing Issue volume. |
| DecIssues | Numeric | Close of data3 | Value to consider as Declining Issues. |
| DecVol | Numeric | Close of data4 | Value to consider as Declining Issue volume. |
| SmoothingLength | Numeric | 4 | Number of bars used to calculate the average of the Arms Index. |
| OverSold | Numeric | 1.25 | Value specifying an oversold market. |
| OverBought | Numeric | .7 | Value specifying an overbought market. |
Market Synopsis
The Arms Index, developed by Richard Arms, is also referred to as TRIN, an acronym for TRading INdex. It is a volume-based indicator, which determines market strength and breadth by analyzing the relationship between advancing and declining issues and their respective volume. The Index is calculated using the following formula: (# of advancing issues / # of declining issues) / (advancing volume/declining volume). The result of this formula is then smoothed by a simple moving average, the length of which is an input (SmoothingLength).
An Index value of 1 indicates that the ratio of up volume to down volume is equal to the ratio of advancing issues to the declining issues. The market is said to be in a neutral state when the Index equals 1, since the up volume is evenly distributed over the advancing issues and that the down volume is evenly distributed over the declining issues.
Many analysts believe the Arms Index provides a bullish signal when it is below 1 and a bearish signal when it is above 1. However, the Index also is said to be useful as an overbought/oversold indicator. Used in this way, if the Index is greater than the oversold level specified by the OverSold input, a buying opportunity may be near. Conversely, if the Arms Index is less than the overbought level specified by the OverBought input, the market may present a selling opportunity.
Please refer to the notes below for important information pertaining to data required to plot this indicator.
Plot Information
| Number | Name | Default Color | Description |
| Plot1 | ArmsX | Cyan | Plots the Arms Index. |
| Plot2 | ArmsXAvg | Magenta | Plots the average of the Arms Index. |
| Plot3 | OverSld | Dark Green | Plots the oversold reference line. |
| Plot4 | OverBot | Dark Green | Plots the overbought reference line. |
When applied to a chart, this indicator contains four plots, displayed in a separate subgraph from the price data.
![]() In order to apply the Arms Index indicator to a chart, you must add four index symbols to your chart analysis window. Data1 represents the number of advancing issues and Data2 their up volume. Data3 represents the number of declining issues and Data4 their down volume.
In order to apply the Arms Index indicator to a chart, you must add four index symbols to your chart analysis window. Data1 represents the number of advancing issues and Data2 their up volume. Data3 represents the number of declining issues and Data4 their down volume.