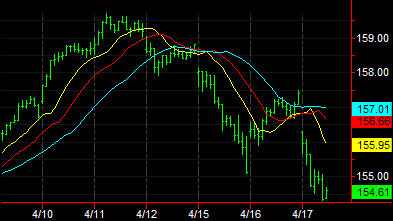
 Alligator (Indicator)
Input Information
| Name | Expression | Default | Description |
| Price | Numeric | Close | Value used in calculating the moving average. |
| JawMALength | Numeric | 13 | Bars used for the Jaw moving average. |
| TeethMALength | Numeric | 8 | Bars used for the Teeth moving average. |
| LipsMALength | Numeric | 5 | Bars used for the Lips moving average. |
| JawPlotDisplace | Numeric | -8 | Bars to displace the Jaw plot. Negative values displace into the future. |
| TeethPlotDisplace | Numeric | -5 | Bars to displace the Teeth plot. Negative values displace into the future. |
| LipsPlotDisplace | Numeric | -3 | Bars to displace the Lips plot. Negative values displace into the future. |
| TruncatePlotsAtLastBar | Numeric | 1 | Set to 1 to not plot into the future on last bar. |
Market Synopsis
The Alligator indicator consists of three smoothed moving averages. When the lines are inter-twinned the 'alligator' is at rest and out of the market. When the lines are separated in an up or down direction the 'alligator' is hungry to buy on the up trend and to sell on the down trend.
Plot Information
| Number | Name | Default Color | Description |
| Plot1 | Jaw | Cyan | Plots the Jaw exponential moving average. |
| Plot2 | Teeth | Teeth | Plots the Teeth exponential moving average. |
| Plot3 | Lips | Yellow | Plots the Lips exponential moving average. |
When applied to a chart, this indicator plots three moving averages on a separate subgraph from the price data.
