 Advance-Decl Ratio (Indicator)
Input Information
| Name | Expression | Default | Description |
| AdvIssues | Numeric | Close of Data2 | Price data considered as Advancing Issues. |
| DecIssues | Numeric | Close of Data3 | Price data considered as Declining Issues. |
Market Synopsis
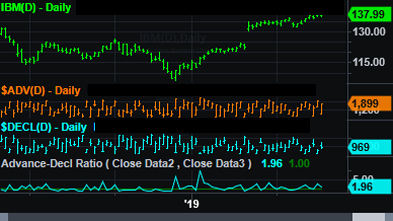
The Advance-Decl Ratio indicator calculates the ratio of advancing issues to declining issues and plots this value. The relationship between advancing issues and declining issues is known as market breadth. For example, if a stock market index is rallying but there are more issues declining than advancing, then the rally is narrow and much of the stock market is not participating. To plot the Advance-Decline Ratio accurately, the chart must contain both the Advancing Issues and the Declining Issues and the inputs must specify the correct data number for each.
Plot Information
| Plot Number | Plot Name | Default Color | Description |
| Plot1 | A/DRatio | Cyan | Plots the Advance Decline Ratio value. |
| Plot2 | BaseLine | Green | Plots a zero line for reference. |
When applied to a chart, this indicator displays one plot in a separate subgraph from the price data.
![]() In order to apply the Advance-Decl Ratui indicator to a chart, you must plot two symbols in addition to the primary symbol being traded as Data1. The first additional symbol, Data2, represents the number of advancing issues and their volume. The second additional symbol, Data3, represents the number of declining issues and their volume.
In order to apply the Advance-Decl Ratui indicator to a chart, you must plot two symbols in addition to the primary symbol being traded as Data1. The first additional symbol, Data2, represents the number of advancing issues and their volume. The second additional symbol, Data3, represents the number of declining issues and their volume.