 Accel Decel Oscillator (Indicator)
Input Information
| Name | Expression | Default | Description |
| Price | Numeric | MedianPrice | Value to be used in calculating the oscillator. |
| FastLength | Numeric | 5 | Bars to include in calculating the "fast" moving average. |
| SlowLength | Numeric | 34 | Bars to include in calculating the "slow" moving average. |
| ACLength | Numeric | 5 | Bars to include in calculating the average value of the Awesome Oscillator. |
| UpColor | Numeric | UpDefaultColor | Color of histogram when current bar oscillator is greater than previous bar. |
| DownColor | Numeric | DownDefaultColor | Color of histogram when current bar oscillator is less than previous bar. |
| AboveZeroBuyColor | Numeric | Yellow | Color of marker for Above Zero Buy setup. |
| BelowZeroBuyColor | Numeric | Cyan | Color of marker for Below Zero Buy setup. |
| CrossZeroBuyColor | Numeric | LightGrey | Color of marker for Cross Zero Buy setup. |
| BelowZeroSellColor | Numeric | Magenta | Color of marker for Below Zero Sell setup. |
| AboveZeroSellColor | Numeric | MyColors( "Azure" ) | Color of marker for Above Zero Sell setup. |
| CrossZeroSellColor | Numeric | MyColors( "Orange" ) | Color of marker for Cross Zero Sell setup. |
| PlotBuySetupDots | TrueFalse | True | True to show marker when Buy setup occurs. |
| PlotSellSetupDots | TrueFalse | True | True to show marker when Sell setup occurs. |
| ColorCellBGOnAlert | TrueFalse | True | Change cell background color when true, otherwise false. |
| BackgroundColorAlertCell | Numeric | DarkGrey | Color of cell background to use if above value is True. |
Market Synopsis
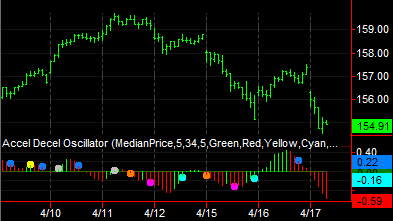
The Accel Decel Oscillator is based on an indicator created by Bill Williams and shows the current market momentum as a histogram as well as showing buy and sell setup conditions with colored markers.
Plot Information
| Number | Name | Default Color | Description |
| Plot1 | AC | UpColor/DownColor | Plots the Accel Decel Oscillator histogram. |
| Plot2 | Pattern | DarkBlue | Plots the pattern name in the 2nd grid cell. |
| Plot3 | BuySetup | Cyan | Plots the Buy setup marker. |
| Plot4 | SellSetup | Magenta | Plots the Sell setup marker. |
| Plot5 | ZeroLine | DarkGreen | Plots a zero reference line. |
When applied to a chart, this indicator displays a histogram with color markers in a separate subgraph from the price data.
