 %Chg (Indicator)
Input Information
| Name | Expression | Default | Description |
| Price | Numeric | Close | Price used in calculating the percent change. |
| Length | Numeric | 14 | Number of bars to look back for percent change calculation. |
| HiAlert | Numeric | 0 | Defines the high percent change value that will trigger an alert. |
| LoAlert | Numeric | 0 | Defines the low percent change value that will trigger an alert. |
| UpColor | Numeric | Cyan | Color used when the percent change is positive. |
| DnColor | Numeric | Red | Color used when the percent change is negative. |
Market Synopsis
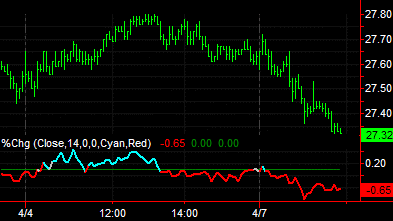
The %Chg indicator calculates and plots the net change, expressed as a percent, between a bar's price, as specified by the input Price, and that price the number of bars ago specified in the input Length.
This indicator is a quick and easy method of viewing price swings between bars, illustrating price volatility.
Plot Information
| Number | Name | Default Color | Description |
| Plot1 | %Chg | Cyan/Red | Plots the percent change value. |
| Plot2 | HiAlert | Dark Green | Plots the high alert reference value. |
| Plot3 | LoAlert | Dark Green | Plots the low alert reference value.. |
When applied to a chart, this indicator displays three plots in a separate subgraph from the price data.