 52 Wk High-Low (Indicator)
Input Information
| Name | Expression | Default | Description |
| Plot52WkHigh | Numeric | 1 | Set to 1 to plot the high, or 0 to not plot the line. |
| Plot52WkLow | Numeric | 1 | Set to 1 to plot the high, or 0 to not plot the line. |
Market Synopsis
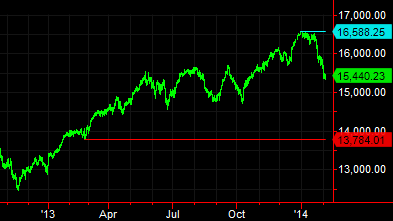
The 52 Wk High-Low Indicator plots the highest high and lowest low of the past 52 weeks. The indicator can only be used with daily data. When applied to a grid, this indicator displays values in two columns of cells.
Plot Information
| Number | Name | Default Color | Description |
| Plot 1 | 52WkHi | Cyan | Plots the highest high value during the last 52 weeks. |
| Plot 2 | 52WkLo | Red | Plots the lowest low value during the last 52 weeks. |