EasyLanguage Scans your Chart Bar-by-Bar
Before you can understand how to write a trading strategy or study in EasyLanguage, it's important to review exactly how EasyLanguage operates.
In TradeStation, a chart typically consists of numerous bars built from price data associated with a specified symbol. Each bar summarizes the prices for a trading interval, most commonly a time period such as five minutes or one day, and includes values such as the open, high, low, and closing prices for the period. Other bar data such as the traded volume and the date/time of the bar's close is also available.
Since one of the primary purposes of EasyLanguage is to look at price data from one bar and compare it to data from other bars, you need to understand how your EasyLanguage procedure (indicator, ShowMe, trading strategy, etc.) reads the price data from a chart.
In this simple one line trading strategy:
if the Close > High of 1 bar ago then Buy next bar at market;
you are instructing EasyLanguage to compare the closing price of one bar with the high price of another and to generate a buy order when the close is greater than the high. This comparison is made on the closing price of every bar in the chart, each time looking at the high price from the bar before.
Even though your EasyLanguage study is applied to a chart filled with bars, the process used to evaluate the data on the chart is always the same. Remember, a chart is simply a visual representation of a period of trading history for a symbol, where individual bars represent trading intervals. Each bar contains basic price data (prices, volume, date, etc.) that was saved from a datafeed. To evaluate your chart, EasyLanguage turns back the clock and starts reading the price data from the first bar in the chart just as it appeared from the datafeed when that bar was created. In terms of your EasyLanguage procedure, this is now the current bar. The EasyLanguage statements in your procedure are always evaluated relative to the current bar. On the first bar, there are no previous bars and the comparison in the example above cannot be true. When your procedure is done evaluating the bar, EasyLanguage steps forward in time to the next bar, making it the current bar on which the statements in your procedure are evaluated.
Typically, an EasyLanguage procedure includes a number of statements, each of which can result in an action such as plotting a line on the chart or generating a buy/sell short order. After all of the statements in the EasyLanguage procedure are processed for the current bar, the price data from the next bar is read and the procedure is run again using the new prices. This continues, across the chart from left to right, until all of the prices from all of the bars on the chart have been read. The result is that, for a 500 bar chart, the EasyLanguage procedure runs a total of 500 times, once on each bar.
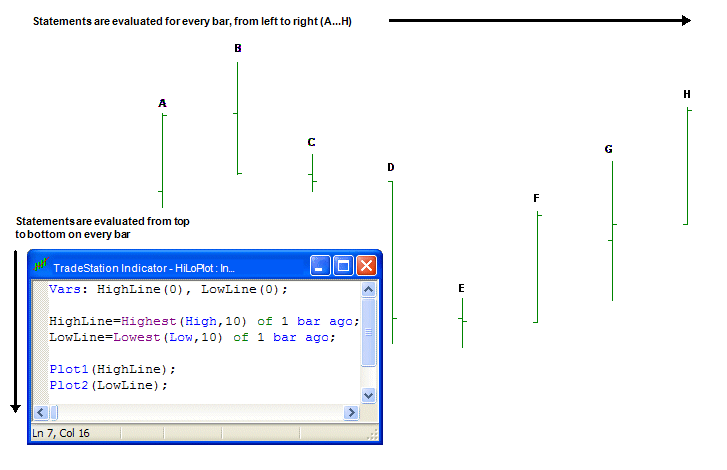
For example, look at the chart above consisting of bars A through H, where the indicator 'HiLoPlot' has been applied. Each line of the five indicator statements are evaluated on every bar, starting with the price data from bar A, then from bar B, etc., across all of the bars in the chart. Even though you may not understand the EasyLanguage statements at this time, it's important to know that each statement is evaluated, in order, for every bar.