EasyLanguage Utilization Monitor
The EasyLanguage Utilization Monitor allows you to analyze and compare the relative utilization of EasyLanguage resources for studies and strategies as applied to charts in your TradeStation platform.
Views
Four different views are provided so that you can easily compare how EasyLanguage calculations are allocated among listed items, and those under it, within a specific view category.
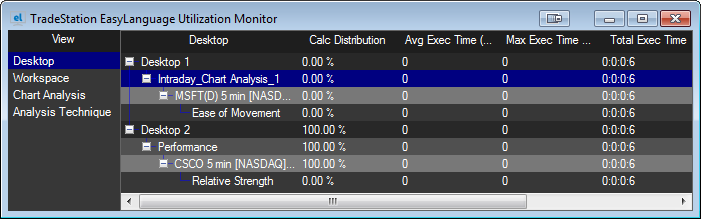
Desktop - Displays analysis items organized by TradeStation desktop.
Workspace - Displays analysis items organized by TradeStation workspace.
Chart Analysis - Displays analysis items organized by the Chart they are applied to.
Study - Displays analysis items organized by Study name.
Statistical Columns
The following columns can set to be displayed in each view. Columns are added/removed by right-clicking on any column and then checking or unchecking items from the Columns selection drop-down list. Click on a column heading to sort the listed items in ascending order or click again to sort in descending order.
Default Columns
Calc Distribution - Shows the relative calculation load that a listed item, and subitems under it, contributes to EasyLanguage processing as a percentage.
Avg Exec Time (microsec) - Shows the average number of micro seconds per second that a listed item, and subitems under it, has taken to execute EasyLanguage instructions.
Avg Calls (per sec) - Shows the average number of times per second that a listed item, and subitems under it, was called to be processed by EasyLanguage.
Additional Columns
Max Exec Time (microsec) - Shows the maximum number of micro seconds that a listed item, and subitems under it, took to execute EasyLanguage instructions.
Total Exec Time - Shows the total amount of EasyLanguage execution time (in seconds) that a listed item, and subitems under it, has accumulated since the item was loaded.
Max Calls - Shows the maximum number of times per second that a listed item, and subitems under it, took to execute EasyLanguage instructions.
Total Calls - Shows the total number of times that a listed item, and subitems under it, was called to be processed by EasyLanguage since the item was loaded.