Corrections, Deletions & Insertions
When a data feed correction is broadcast for an active symbol, you will be able to manually apply the correction (or deletion & insertion)
from either a Chart, RadarScreen
- Correction - Fixing an incorrect price value, volume amount or timestamp
- Deletion - Removing an incorrect tick
- Insertion - Inserting a missing tick
![]() By refreshing the window,
any available corrections for that symbol will automatically be applied.
By refreshing the window,
any available corrections for that symbol will automatically be applied.
Chart Analysis
When the Correction Indication symbol appears on the status line of a chart window, a data feed correction has been identified for a charted symbol. You can choose to apply or ignore the correction by using the Data > Data Corrections menu sequence. You can then choose to apply corrections for symbols in this window to this or other windows based on the menu item selected. In addition, you can choose to ignore the correction for this window which clears the Correction Indication for the corrections received up to this point.
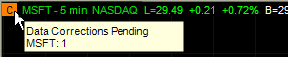
Hovering over the Correction Indication symbol provides you with a tool tip that lists the corrections available for all symbols in that sub-graph, grouped by symbol.
A single Correction Indication symbol to the left of the status line is used to represent corrections for all symbols in that sub-graph.
RadarScreen
The Correction Indication in RadarScreen is a small 'c' is displayed in the upper-right corner of a cell in the symbol column. Since corrections only apply to historical data, a correction indication will appear next to a symbol only when one of more columns require history.
Hovering over the a symbol cell containing a Correction Indication provides you with a tool tip that lists the corrections available for the selected symbol.
If RadarScreen tool tips are disabled in the preferences dialog, you will not be able to see the correction tool tip.
- Activate a RadarScreen window.
- Right-click on a symbol cell containing a Correction Indication
- Select how you want to apply or ignore corrections. You can apply corrections to just this window or to other windows for the selected symbol. In addition, you can choose to ignore the correction for just this symbol or for all symbols in this window which clears the Correction Indication for the corrections received up to this point.
Matrix
Corrections in the Matrix window are automatically applied. When a correction is sent that impacts a symbol in Matrix, the corrections are automatically applied and the Volume graph and VWAP are recalculated and updated accordingly.
A Matrix customize setting is available to control whether corrections are automatically applied and recalculated when a Matrix symbol correction is received:
Under Data Corrections on the Matrix Customize Window > General tab, place a check mark next to Automatically apply data corrections to enable this feature.
Time & Sales
By default, corrections in the Time & Sales window are automatically applied. When a correction is sent that affects a symbol in Time & Sales, either real-time or historical, it will appear at the actual location in the tick stream where the correction took place.
A Time & Sales customize setting is available to control whether corrections are automatically applied when a Time & Sales symbol correction is received:
In the Time & Sales Customize Window > General tab, check Automatically apply data corrections to enable this feature. Uncheck the box if you do not want data corrections to be automatically applied.
In addition, Time & Sales customize settings are available to control how corrections appear. From the Customize Window dialog, click the Color tab. In the Conditional section, click the Corrections tab. Verify that the Enable box is checked, and choose the foreground and background colors that you prefer for each of the available conditions. You can also use a strikethrough style. Click the Use Subtype/Condition colors box for one or more of the available conditions to use the same colors for Corrections as what you selected on the Conditions and Subtypes tabs.