Special Scaling Situations
As part of the Scaling enhancements in TradeStation, when the axis for an indicator is set to Same Axis as Underlying Data (the equivalent setting to the former Same as Symbol scaling setting), the indicator will always appear in the same sub-graph as the underlying data. Thus, an indicator whose axis is set to Same Axis as Underlying Data cannot be displayed in a different sub-graph than the underlying symbol, but a new setting described below will still allow for data series and indicators to be customized in such a way as to give the appearance of being displayed in different sub-graphs.
As a result of the new functionality, Indicators in Chart Analysis windows that were created in TradeStation versions prior to 8.1, and which are set to Same as Symbol and plotted in a different sub-graph than the underlying data, may appear differently in the sub-graph than they did in the prior version of TradeStation. The data series and study customize settings can be modified though, so that their arrangement in the Chart Analysis window will match the appearance in prior versions. A new setting called Make price data invisible, in the Style tab of the Customize Symbol dialog is what makes this possible. When this setting is enabled, the data series prices (bars) are made invisible in the sub-graph, without impacting any of the indicators based on that data series. Below are two examples that demonstrate how this setting can be used.
Example
1
![]()
Suppose that you have the Chart Analysis window below, which contains Data Series and Indicators that are setup as specified in the tables that follow:
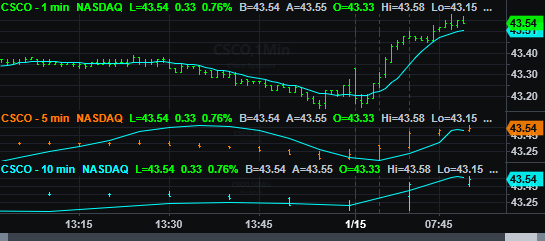
Data Series
| Settings Tab | Scaling Tab | ||||
|---|---|---|---|---|---|
| Symbol | Interval | Axis | Sub graph | Range | |
| Data1 | CSCO | 1 min | Right Axis | 1 | Date Range on Screen |
| Data2 | CSCO | 5 min | Right Axis | 2 | Date Range on Screen |
| Data3 | CSCO | 10 min | Right Axis | 3 | Date Range on Screen |
Indicator
| General Tab | Scaling Tab | |
|---|---|---|
| Name | Base study on | Axis |
| Mov Avg 1 Line | Data1, CSCO 1 min | Same Axis as Underlying Data (sub-graph 1) |
| Mov Avg 1 Line | Data2, CSCO 5 min | Same Axis as Underlying Data (sub-graph 2) |
| Mov Avg 1 Line | Data3, CSCO 10 min | Same Axis as Underlying Data (sub-graph 3) |

If you only want to see the CSCO 1 min data, and you also want to combine the three moving average lines into the same sub-graph, while still calculating them on their respective intervals (1, 5 and 10 min), Data2 (CSCO 5 min) and Data3 (CSCO 10 min) could be moved to sub-graph 1 and set to invisible. The Chart Analysis window below shows the result of the changes, and the tables that follow reflect the Data Series and Indicator settings.
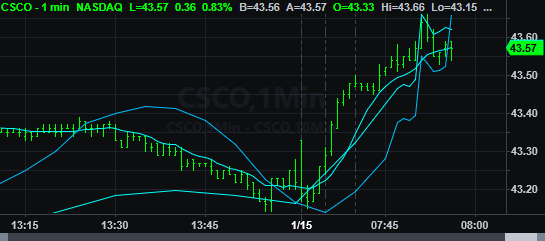
Data Series
| Settings Tab | Style Tab | Scaling Tab | ||||
|---|---|---|---|---|---|---|
| Symbol | Interval | Make price data invisible | Axis | Sub graph | Range | |
| Data1 | CSCO | 1 min | disabled | Right Axis | 1 | Date Range on Screen |
| Data2 | CSCO | 5 min | enabled | Right Axis | 1 | Date Range on Screen |
| Data3 | CSCO | 10 min | enabled | Right Axis | 1 | Date Range on Screen |
Indicator
| General Tab | Scaling Tab | |
|---|---|---|
| Name | Base study on | Axis |
| Mov Avg 1 Line | Data1, CSCO 1 min | Same Axis as Underlying Data |
| Mov Avg 1 Line | Data2, CSCO 5 min | Same Axis as Underlying Data |
| Mov Avg 1 Line | Data3, CSCO 10 min | Same Axis as Underlying Data |
Example 2 ![]()
Suppose that you have the Chart Analysis window below, which contains Data Series and Indicators that are setup as specified in the tables that follow:
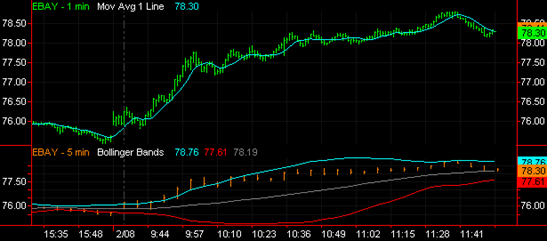
Data Series
| Settings Tab | Scaling Tab | ||||
|---|---|---|---|---|---|
| Symbol | Interval | Axis | Sub graph | Range | |
| Data1 | EBAY | 1 min | Right Axis | 1 | Date Range on Screen |
| Data2 | EBAY | 5 min | Right Axis | 2 | Date Range on Screen |
Indicator
| General Tab | Scaling Tab | |
|---|---|---|
| Name | Base study on | Axis |
| Mov Avg 1 Line | Data1, EBAY 1 min | Same Axis as Underlying Data |
| Bollinger Bands | Data2, EBAY 5 min | Same Axis as Underlying Data |
If you decide that you want to see a moving average indicator based on the Data2 (EBAY 5 min), but you want it displayed in the same sub-graph as the other moving average, you would first add another EBAY 5 min data series to the chart. This new data series would be set to invisible in the Style tab and would be set to Sub-graph 1 in the Axis tab. The Mov Avg 1 Line indicator would then be inserted on the chart, based on Data3 (the invisible CSCO 5 min). The Chart Analysis window below shows the result of these changes, and the tables that follow reflect the data series and indicator settings.
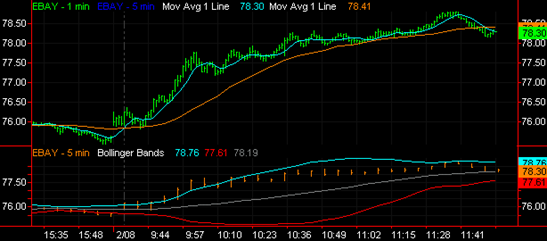
Data Series
| Settings tab | Style tab | Scaling tab | ||||
|---|---|---|---|---|---|---|
| Symbol | Interval | Make price data invisible | Axis | Sub graph | Range | |
| Data1 | EBAY | 1 min | disabled | Right Axis | 1 | Date Range on Screen |
| Data2 | EBAY | 5 min | disabled | Right Axis | 2 | Date Range on Screen |
| Data3 | EBAY | 5 min | enabled | Right Axis | 1 | Date Range on Screen |
Indicator
| General Tab | Scaling Tab | |
|---|---|---|
| Name | Base study on | Axis |
| Bollinger Bands | Data2, EBAY 5 min | Same Axis as Underlying Data |
| Mov Avg 1 Line | Data1, EBAY 1 min | Same Axis as Underlying Data |
| MovAvg 1 Line | Data3, EBAY 5 min | Same Axis as Underlying Data |