Account Orders & Positions
Account Orders & Positions provides users with a convenient and integrated way to monitor trades for selected symbols directly on a chart. It allows users to see open and filled orders by placing markers on a chart along with the type of order and the size in shares or contracts.
When enabled on a chart, Account Orders & Positions plots order markers from a specific account across the range of bars loaded into the chart. On multi-symbol charts, Account Orders & Positions can be displayed on each symbol's data stream even if plotted in the same sub-graph.
![]() Access from Chart Analysis using the Settings > Account Orders & Positions menu sequence. The Customize Account Orders & Positions dialog is now displayed.
Access from Chart Analysis using the Settings > Account Orders & Positions menu sequence. The Customize Account Orders & Positions dialog is now displayed.
![]() To remove Account Orders & Positions markers, right-click on a marker and select Disable Account Orders & Positions.
To remove Account Orders & Positions markers, right-click on a marker and select Disable Account Orders & Positions.
![]() You can use the Data tab to select the account to use for an asset class.
You can use the Data tab to select the account to use for an asset class.
![]() VIDEO - Monitoring Orders and Positions Using a Chart
VIDEO - Monitoring Orders and Positions Using a Chart
Filled Orders
By default:
- Buy - Displays an upward pointing blue arrow with a round tail and a round blue tick pointer at the order's price point on the bar.
- Sell Short - Displays a downward pointing red arrow with a round tail and a round red tick pointer at the order's price point on the bar.
- Buy to Cover - Displays an upward pointing white arrow with a round tail and a round white tick pointer at the order's price point on the bar.
- Sell - Displays a downward pointing white arrow with a round tail and a round white tick pointer at the order's price point on the bar.
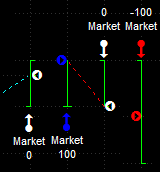
Each fill type also includes a text label that indicates the type of order (Limit, Market, Stop Limit, or Stop Market) and the resulting position after the order was filled in shares or contracts.
In some cases, the Account Orders & Positions markers will point to bars that also include arrows generated by strategies. When this happens, the Account Orders & Positions markers will be placed further from the bar and the strategy arrows closer to the bar.
Open Orders
Open orders plot a horizontal line at the Limit or Stop price extending from the initial order bar to the right of the chart. The line is labeled with the number of shares or contracts to the left of the line.
Multiple Fills on the Same Bar
In the case where multiple entry and exit arrows are displayed on a single bar (indicating multiple fills on that bar) you can choose a setting from the Customize Position Arrows window that uses a double-headed arrow to represent multiple entry or exit fills on the same bar.
- From a chart containing fill arrows, select Settings > Account Orders & Positions from the shortcut menu.
- From the Settings tab, select Filled from the Order Status list, and click Customize.
- Select either the Entries or Exits tab, place a check mark next to Use a single arrow (double arrowhead) to reflect multiple trades on a bar to display a double headed arrow to represent multiple fills on a single bar.
Related Topics
Account Orders & Positions Onscreen Cues