OptionStation Pro
Settings Panel
The Settings panel enables you to adjust the way you view and work with options, including:
- Common options attributes, including Volatility, Interest Rates, and Pricing Model;
- Risk Graph settings, including 2D graph plots;
- Option Chain display parameters;
- Real Positions settings; and
- Order account settings.
By default, the Settings panel is displayed in the upper right corner of OptionStation
Pro. If the Settings panel is not visible, click View > Settings. View the Working with Panels topic for details.
Sections - The settings are grouped together into sections. The items in each section can be listed by clicking the down-arrows  on the category title line to expand the list, or by clicking the up arrows
  to collapse the section.
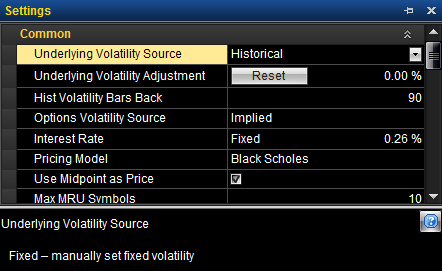
Mini-Help - Highlighting any item (such as Underlying Volatility Source, above) in the Settings panel will display a brief description for that item in the bottom section of the panel. You can resize the panel and drag the horizontal dividing line up or down to increase the size of the description.
Common
The Common section lets you manage settings that apply to the source and calculation parameters for volatility.
- Underlying Volatility Source - Contains a drop-down list that lets you select how underlying volatility will be calculated. Changing this setting affects the plot of the Probability Cone, and will be the number you will see in the Probability Cone legend. Be aware that the calculations are subject to a Switch-Over technique that automatically uses a different method to calculate volatility if the selected method becomes unreliable because of missing or insufficient data. The switch occurs in the following order starting from the current selection: VIX -> Historical -> Fixed.
- Underlying Volatility Adjustment ( +/- %) - Allows you to enter the percentage of volatility that will be added or subtracted to/from the Underlying Volatility Source. Click the Reset button to return the volatility adjustment back to the default of 0%.
- Hist Volatility Bars Back - Adjusts the number of closing prices used to calculate historic volatility (select between 20 - 250).
- Options Volatility Source - Contains a drop-down list that lets you select Implied volatility (IV) or IV Skew Approximation. Changing this setting affects the plot(s) of the Risk Graph before expiration and the Price Point values.
- Implied (default) - Uses Implied Volatility as calculated from the current option price.
- IV Skew Approximation - Uses an approximation technique to create a volatility curve that fits the current implied volatility values within a given expiration term.
- Interest Rate - Contains a drop-down list that lets you select a fixed or automatic rate and a text box to enter the percentage.
- Pricing Model - Contains a drop-down list that lets you select the Black-Scholes or the Bjerksund-Stensland model for option pricing, sensitivity, and volatility calculations.
- Use Midpoint as Price - Check this box to use the midpoint price for volatility calculations, or leave it unchecked to use the natural prices.
- Max MRU Symbols - Adjusts the maximum number of Most Recently Used (MRU) symbols displayed in the symbol lookup (select between 0 - 40).
Graph
The Graph section allows you to define the view in your Risk Graph based on the parameters you select. This is a valuable tool in evaluating potential trades and testing how they would profit from market changes and time variables.
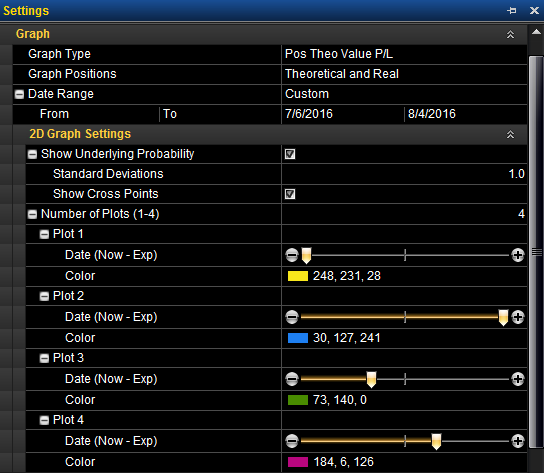
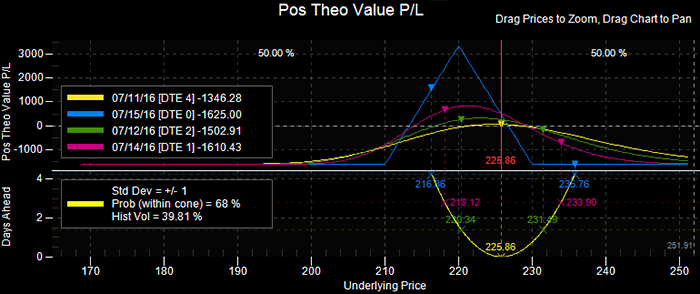
- Graph Type - Contains a drop-down list of different types of data that can be plotted in the Risk Graph. You can choose Position (Pos) Theo Value P&L, Pos Delta, Pos Theta, Pos Gamma, Pos Vega, or Pos Rho to be plotted in the Y axis (along the left side) of the graph. The underlying price is fixed on the X axis along the bottom.
For example, on a two line Pos Theo Value P&L (Profit and Loss) graph, the yellow line (using the default colors) on the Risk Graph represents the current day's P&L, and the blue line represents the P&L at expiration date. The dates of the plots are listed in the legend. Asset price is shown along the bottom (X-Axis). Profit or Loss in dollars is shown along the left side (Y-Axis). The probability cone (yellow line) may optionally appear on the bottom half of the graph.
- Graph Positions - Contains a drop-down list that allows you to select the positions to graph: Real, Theoretical, or both.
- Date Range - Controls the amount of time the graph that will have available to plot. Now - To Earliest Expiration is the default. However, you can select Now - To Latest Expiration or Custom.
 Changing the From date redefines what is considered the Now date in other controls. Likewise, changing the To date redefines the Exp date.
When you choose a Custom date range, click the plus sign  next to Date Range. The From and To dates display. To change the dates, you can either type in the dates (use MM/DD/YYYY), or use the calendar. Click the drop-down arrows next to a start and end date to display a calendar, and select the dates.
The date at the top of the calendar shows today's date. The dates in the Settings panel are the From and To dates that you choose.
2D Graph Settings
The 2D Graph Settings is a sub-section of the Graph section that includes settings to control the number of plots and their appearance in the 2D Graph panel.
Option Chains
- Specifies the settings for options chains.
Real Positions Panel Settings
- Specifies the settings to show for a single symbol.
Order Settings
- Account - Specifies the default TradeStation account number that you want to use for placing orders.
 or plus