TradeStation Help
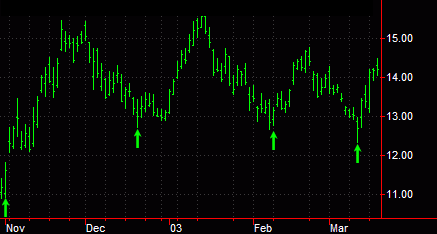
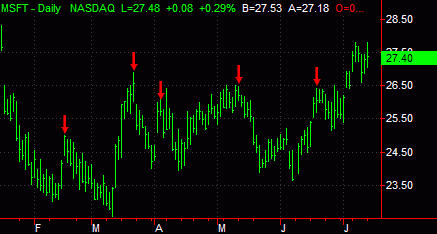
Up and Down Arrows are non-analytical drawing tools used to highlight specific portions of a chart you believe are significant. Arrows allow you to denote specific occurrences such as the bar you purchased a stock, sold a stock, identified an up trend, etc.
You can use Up and Down Arrows in conjunction with analytical tools. For example, there is always a period of time between when a trading strategy generates an order and when that order is filled. This difference in price is known as slippage. You could insert Arrows indicating the actual bar your position was filled and then calculate the difference between your strategy's generation of orders and when your orders are filled to determine an average slippage amount. You can then incorporate this slippage amount into the cost analysis of your strategy to calculate more accurate Strategy Performance Report results.
Up Arrow

Down Arrow

You can also use the shortcut menu for a selected object to change the drawing properties such as Color, Style, Weight, and any object specific settings.
Drawing objects are applied to a chart to assist with data analysis. See About Drawing Objects for more details.
After an arrow is applied to a chart, you can reposition this drawing object at any time.