TradeStation Help
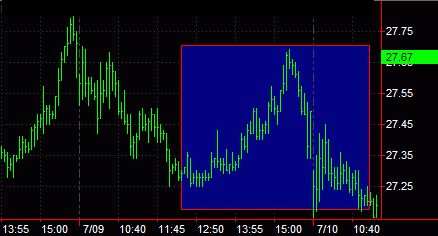
A Rectangle is a non-analytical drawing tool used to highlight specific portions of a chart you believe are significant. For example, Rectangles can highlight a group of bars signifying an upward or downward trending market.
You can also use Rectangles in conjunction with analytical tools. For example, you might use Rectangles to signify what you believe are upward trends. You can then apply an analysis technique that identifies upward trends to determine if your non-analytical interpretation meets the analysis technique's criteria for an upward trend. Combining non-analytical drawing tools with analytical tools allows you to gauge how well you are able to visually identify market phenomenon before incorporating technical analysis studies in your chart.

You can also use the shortcut menu for a selected object to change the drawing properties such as color, style, weight, and any object specific settings.
Drawing objects are applied to a chart to assist with data analysis. See About Drawing Objects for more details.
After a Rectangle is applied to a chart, you can reposition the drawing object at any time to bring attention to another group of bars.
Formatting the Settings of a Rectangle