TradeStation Help
Kagi charts were created in the 1870's when the Japanese stock market started trading. Kagi charts displays a series of connecting vertical lines whose thickness and direction are dependent on what is happening in the market. In TradeStation, the Kagi reversal amount can be specified as a fixed price or percentage.
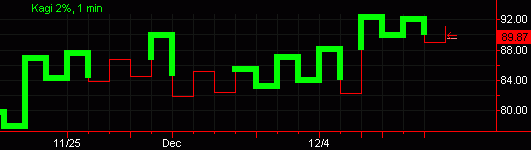
In this example, the Kagi chart is using a 2% reversal:
The Reversal amount is the minimum price movement needed for a new reversal line to be drawn in the Kagi chart. A fixed price or a percentage can be specified for the Reversal amount. The Reversal amount must be greater than the minimum move, and should be evenly divisible by the minimum move or rounding errors may occur.
The Interval setting defines the interval of the data used to build the Kagi Lines. The appropriate interval depends on your market perspective. Users with a short-term perspective may benefit from using smaller intervals (more precision/noise). Users with a long-term perspective may benefit from larger intervals (less precision/noise).
Due to the construction definition of Kagi charts, the back-testing and automation of strategies is not recommended when using this chart type; unless the underlying interval is set to '1 Tick' and stop/limit type orders are used, taking precautions to avoid placing these orders where they would be filled within the "reversal range". For additional information on back-testing and automating strategies on Advanced Chart Types, see Advanced Chart Types - Strategy Back-Testing & Automation.
![]() For a
comprehensive list of command line commands, see Command Line References (All Commands) or Command
Line Reference (Sorted by Application).
For a
comprehensive list of command line commands, see Command Line References (All Commands) or Command
Line Reference (Sorted by Application).